Phreesia Investor Presentation Deck
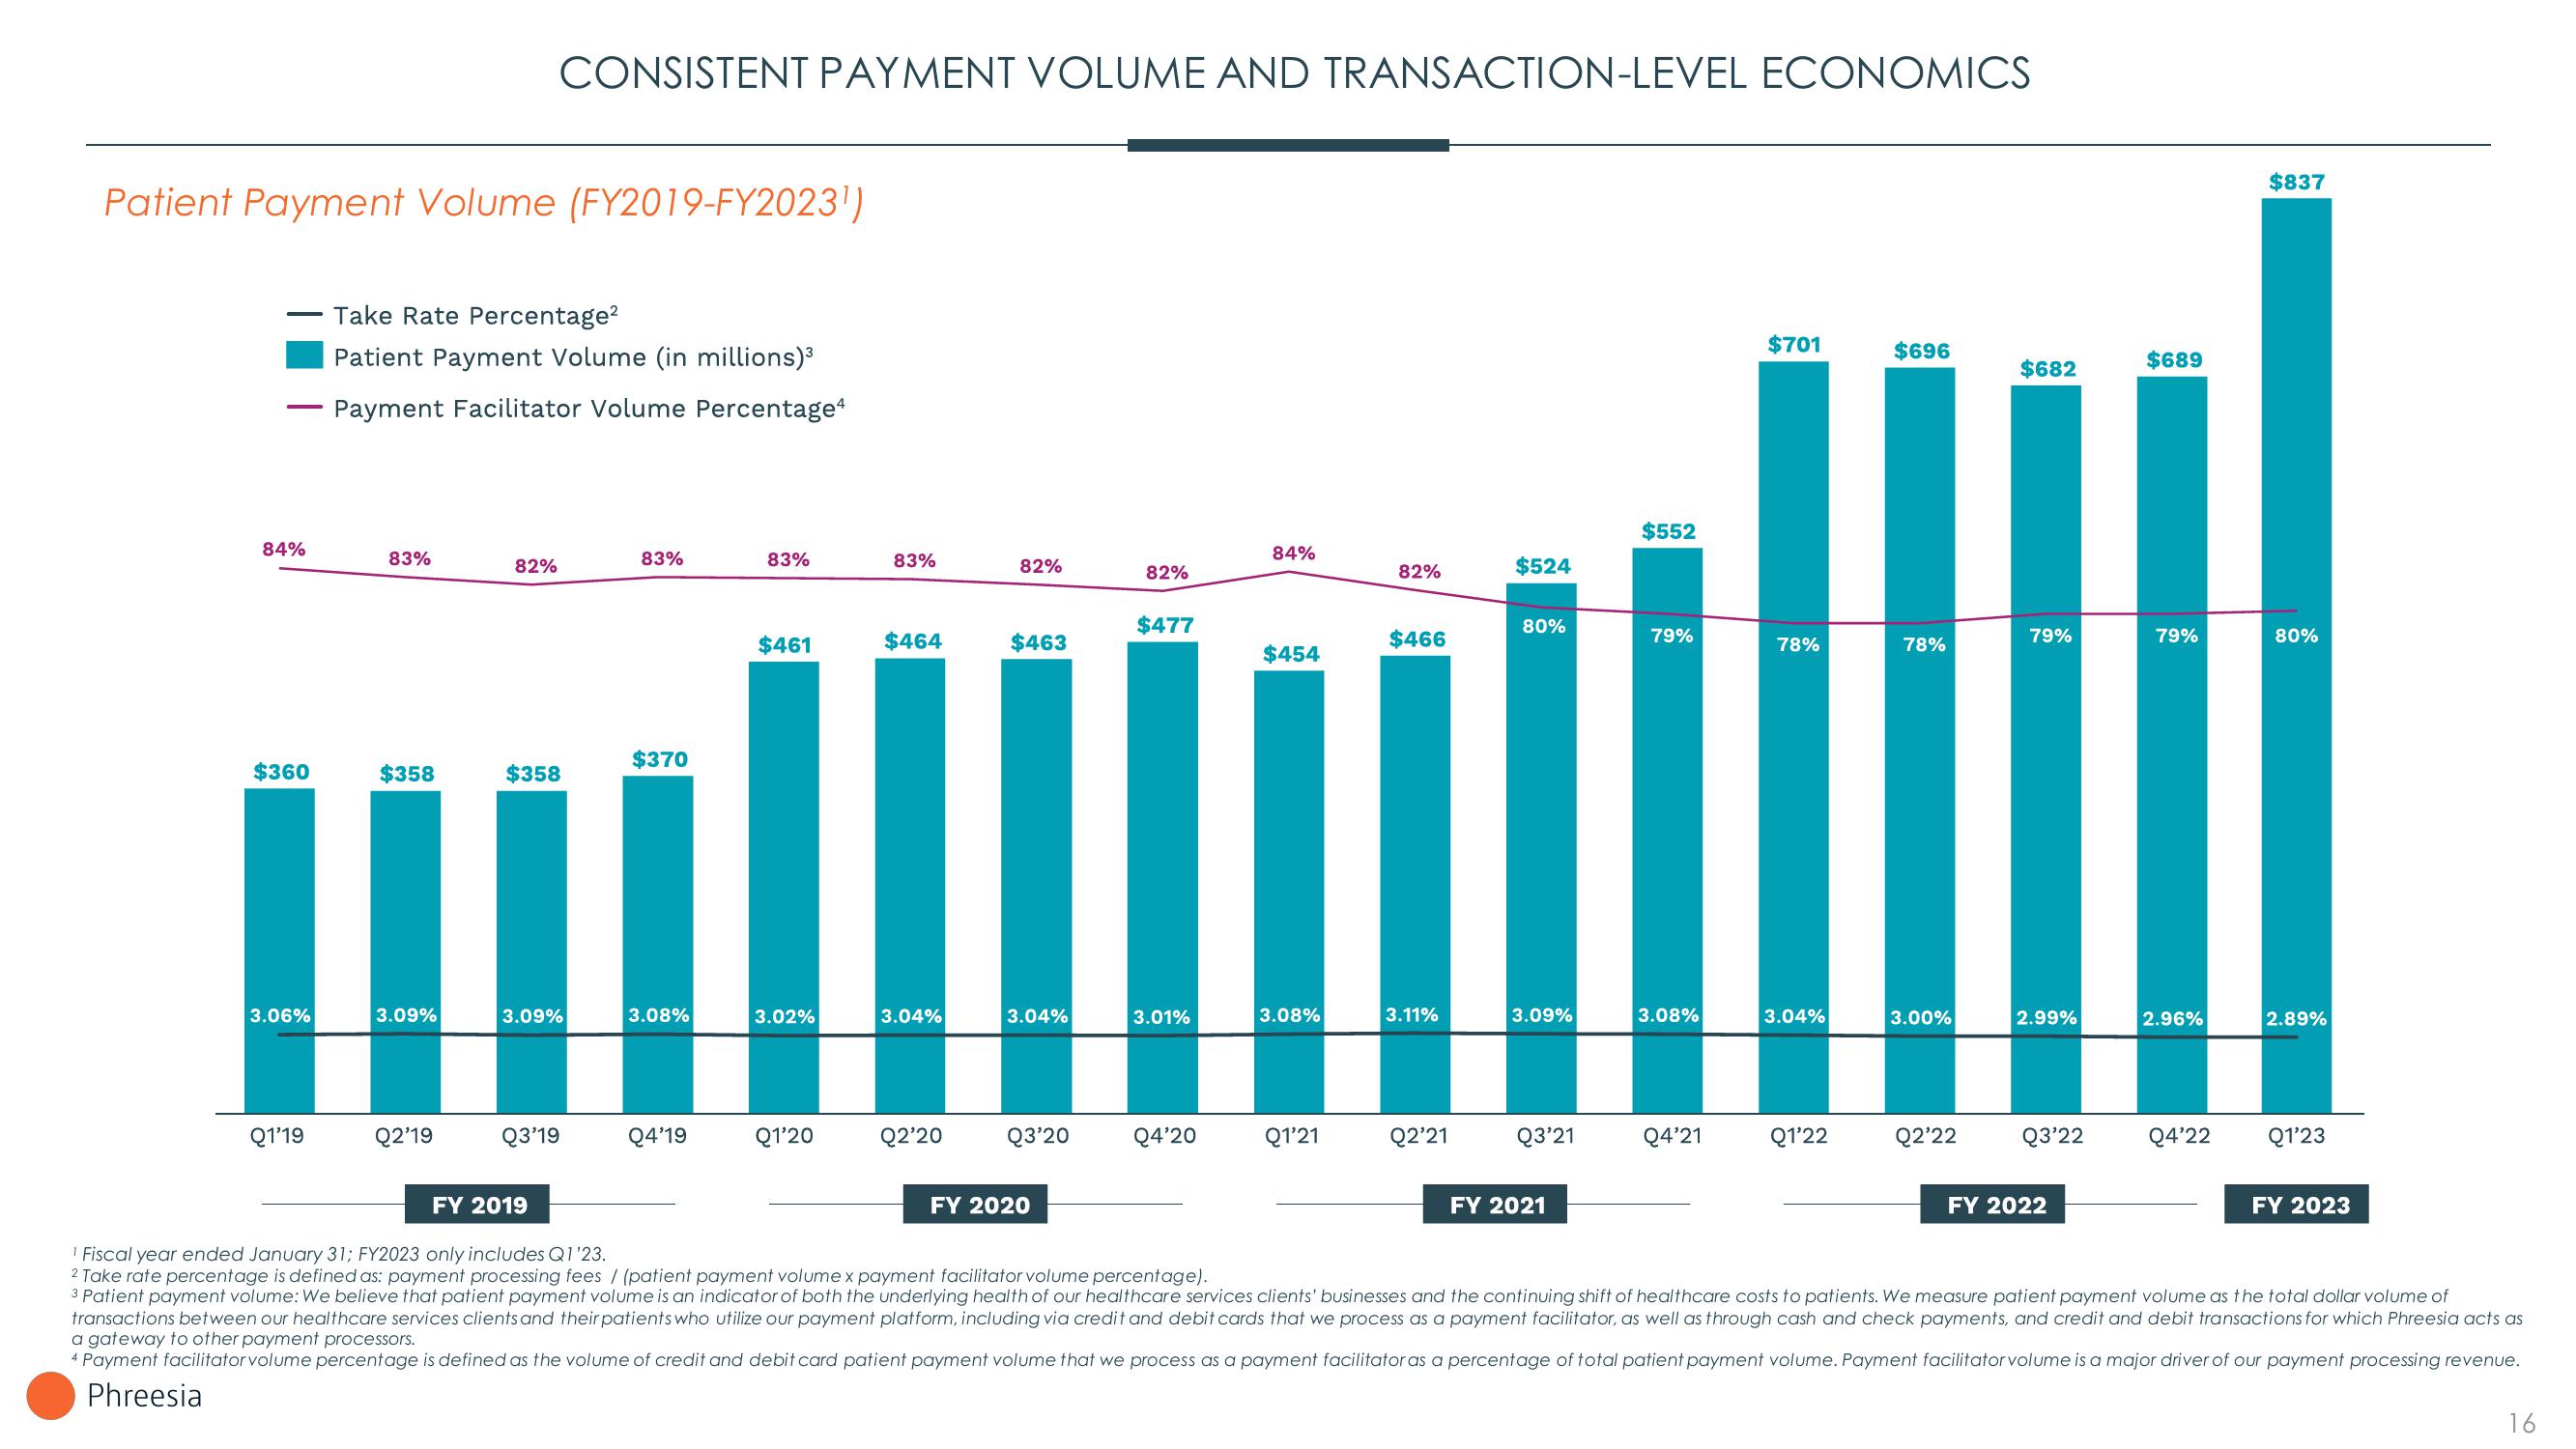
Patient Payment Volume (FY2019-FY2023¹)
84%
$360
3.06%
Q1'19
Take Rate Percentage²
Patient Payment Volume (in millions)³
Payment Facilitator Volume Percentage4
83%
$358
3.09%
Q2'19
82%
CONSISTENT PAYMENT VOLUME AND TRANSACTION-LEVEL ECONOMICS
$358
3.09%
Q3'19
83%
$370
3.08%
Q4'19
83%
$461
3.02%
Q1'20
83%
$464
3.04%
Q2'20
82%
$463
3.04%
Q3'20
FY 2020
82%
$477
3.01%
Q4'20
84%
$454
3.08%
Q1'21
82%
$466
3.11%
Q2'21
$524
80%
3.09%
Q3'21
FY 2021
$552
79%
3.08%
Q4'21
$701
78%
3.04%
Q1'22
$696
78%
3.00%
Q2'22
$682
79%
2.99%
Q3'22
FY 2022
$689
79%
2.96%
Q4'22
$837
80%
FY 2019
¹ Fiscal year ended January 31; FY2023 only includes Q1'23.
2 Take rate percentage is defined as: payment processing fees / (patient payment volume x payment facilitator volume percentage).
3 Patient payment volume: We believe that patient payment volume is an indicator of both the underlying health of our healthcare services clients' businesses and the continuing shift of healthcare costs to patients. We measure patient payment volume as the total dollar volume of
transactions between our healthcare services clients and their patients who utilize our payment platform, including via credit and debit cards that we process as a payment facilitator, as well as through cash and check payments, and credit and debit transactions for which Phreesia acts as
a gateway to other payment processors.
4 Payment facilitator volume percentage is defined as the volume of credit and debit card patient payment volume that we process as a payment facilitator as a percentage of total patient payment volume. Payment facilitator volume is a major driver of our payment processing revenue.
Phreesia
2.89%
Q1'23
FY 2023
16View entire presentation