Comcast Results Presentation Deck
Content &
Experiences
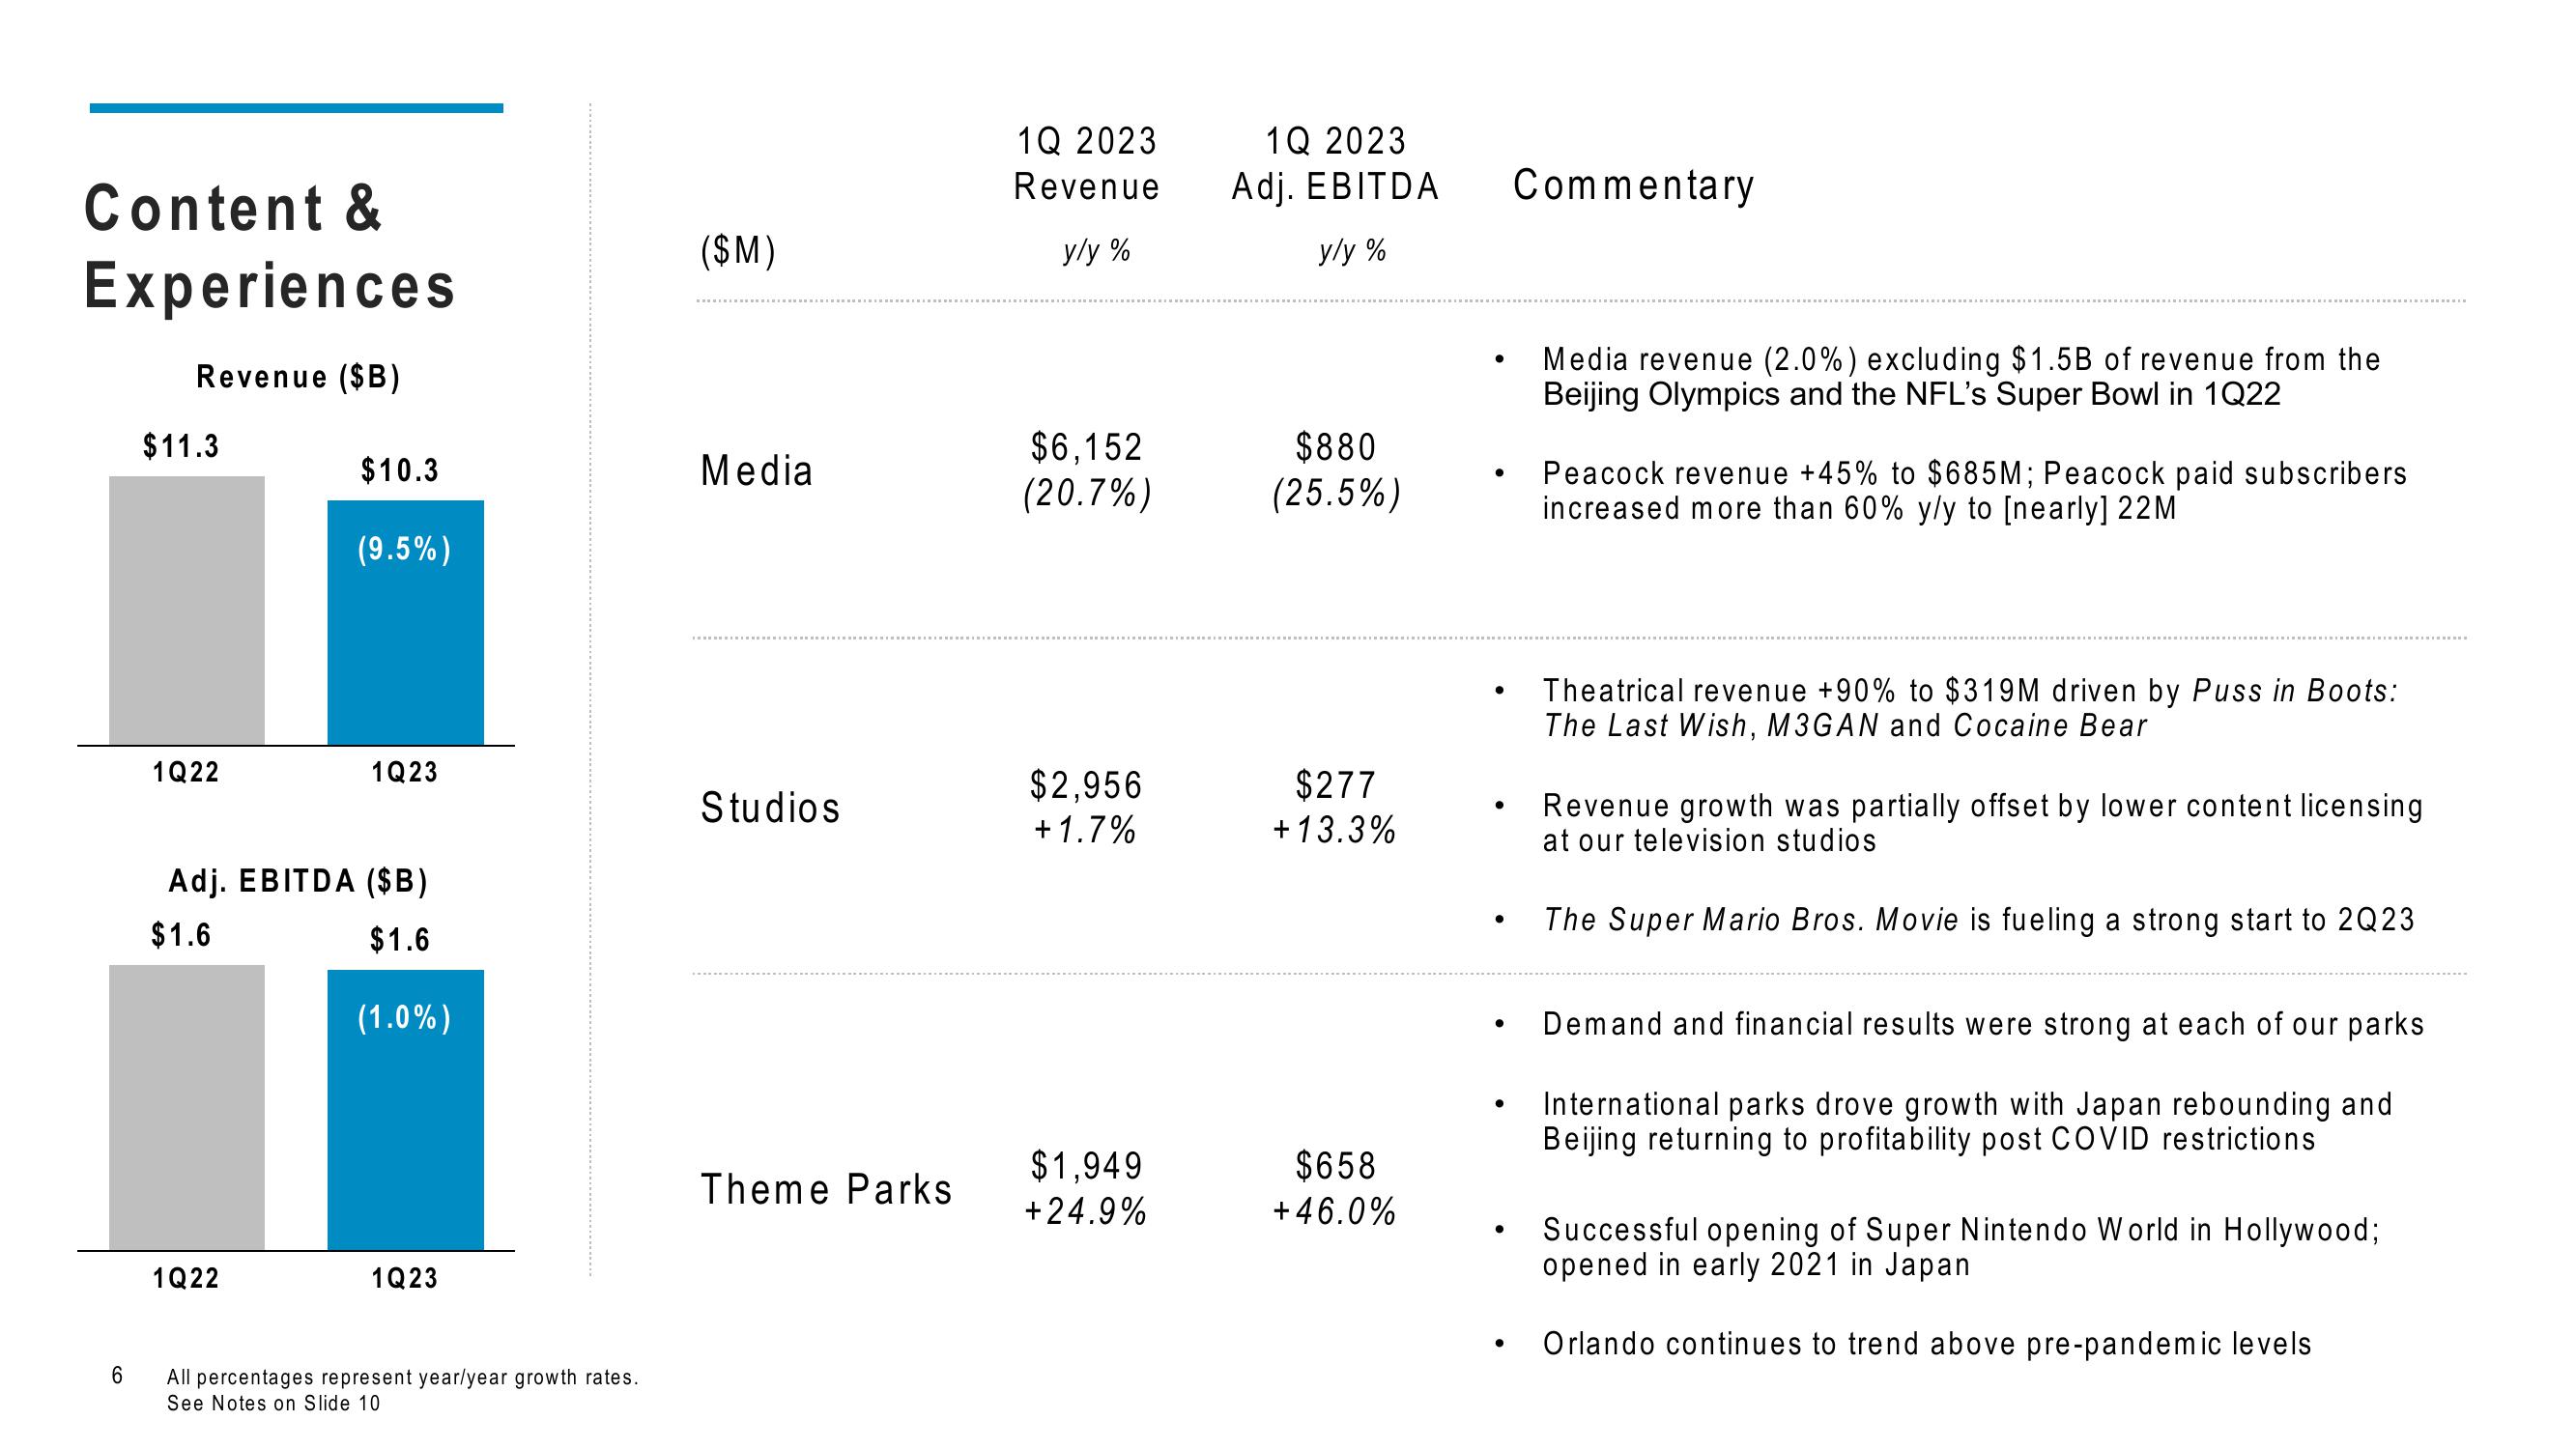
Revenue ($B)
6
$11.3
1Q22
$10.3
1Q22
(9.5%)
1Q23
Adj. EBITDA ($B)
$1.6
$1.6
(1.0%)
1Q23
All percentages represent year/year growth rates.
See Notes on Slide 10
($M)
Media
Studios
Theme Parks
1Q 2023
Revenue
y/y%
$6,152
(20.7%)
$2,956
+1.7%
$1,949
+24.9%
1Q 2023
Adj. EBITDA
y/y%
$880
(25.5%)
$277
+ 13.3%
$658
+46.0%
●
●
●
●
●
●
●
Commentary
Media revenue (2.0%) excluding $1.5B of revenue from the
Beijing Olympics and the NFL's Super Bowl in 1Q22
Peacock revenue +45% to $685M; Peacock paid subscribers
increased more than 60% y/y to [nearly] 22M
Theatrical revenue +90% to $319M driven by Puss in Boots:
The Last Wish, M3GAN and Cocaine Bear
Revenue growth was partially offset by lower content licensing
at our television studios
The Super Mario Bros. Movie is fueling a strong start to 2Q23
Demand and financial results were strong at each of our parks
International parks drove growth with Japan rebounding and
Beijing returning to profitability post COVID restrictions
Successful opening of Super Nintendo World in Hollywood;
opened in early 2021 in Japan
Orlando continues to trend above pre-pandemic levelsView entire presentation