SmileDirectClub Investor Presentation Deck
Balance sheet highlights.
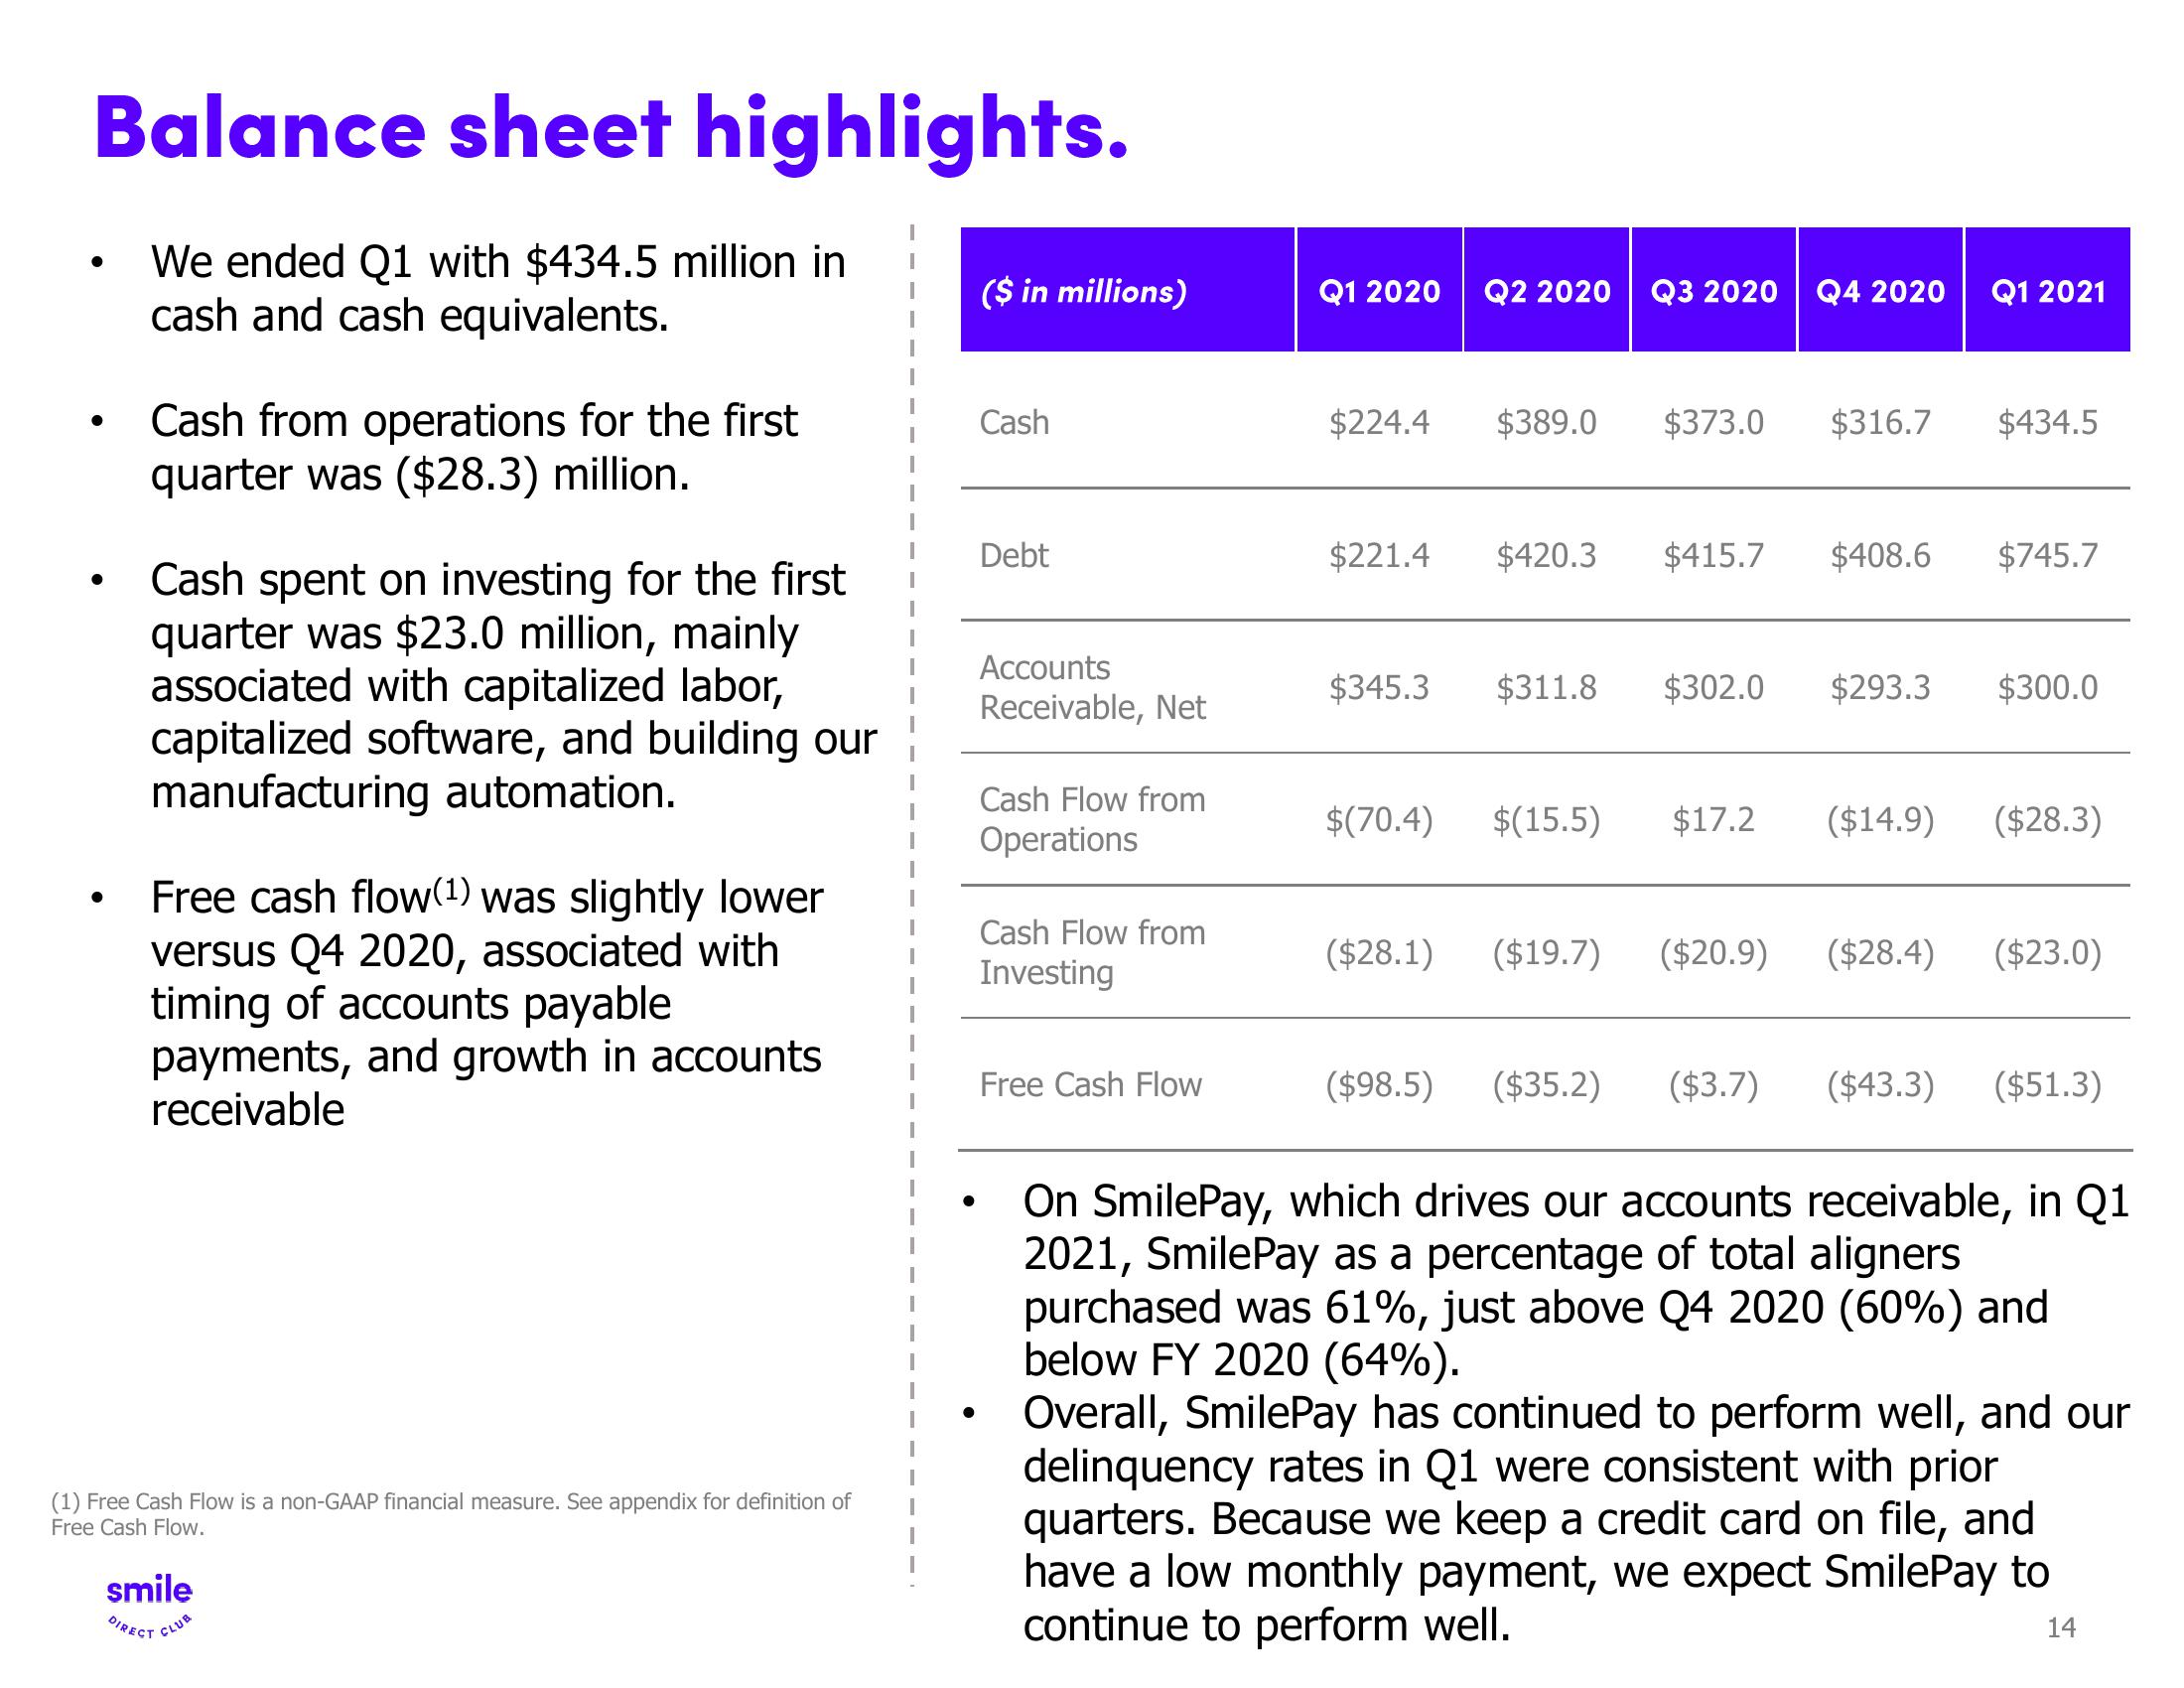
We ended Q1 with $434.5 million in
cash and cash equivalents.
●
●
●
Cash from operations for the first
quarter was ($28.3) million.
Cash spent on investing for the first
quarter was $23.0 million, mainly
associated with capitalized labor,
capitalized software, and building our
manufacturing automation.
Free cash flow(1) was slightly lower
versus Q4 2020, associated with
timing of accounts payable
payments, and growth in accounts
receivable
(1) Free Cash Flow is a non-GAAP financial measure. See appendix for definition of
Free Cash Flow.
smile
DIRECT CLUB
($ in millions)
Cash
Debt
Accounts
Receivable, Net
Cash Flow from
Operations
Cash Flow from
Investing
Free Cash Flow
Q1 2020
$224.4
$221.4
Q2 2020
$389.0
$420.3
Q3 2020 Q4 2020
$373.0 $316.7
$415.7 $408.6
$345.3 $311.8 $302.0 $293.3
Q1 2021
$434.5
$745.7
$300.0
$(70.4) $(15.5) $17.2 ($14.9) ($28.3)
($28.1) ($19.7) ($20.9) ($28.4) ($23.0)
($98.5) ($35.2) ($3.7) ($43.3) ($51.3)
On SmilePay, which drives our accounts receivable, in Q1
2021, SmilePay as a percentage of total aligners
purchased was 61%, just above Q4 2020 (60%) and
below FY 2020 (64%).
Overall, SmilePay has continued to perform well, and our
delinquency rates in Q1 were consistent with prior
quarters. Because we keep a credit card on file, and
have a low monthly payment, we expect SmilePay to
continue to perform well.
14View entire presentation