Azure Power Investor Presentation
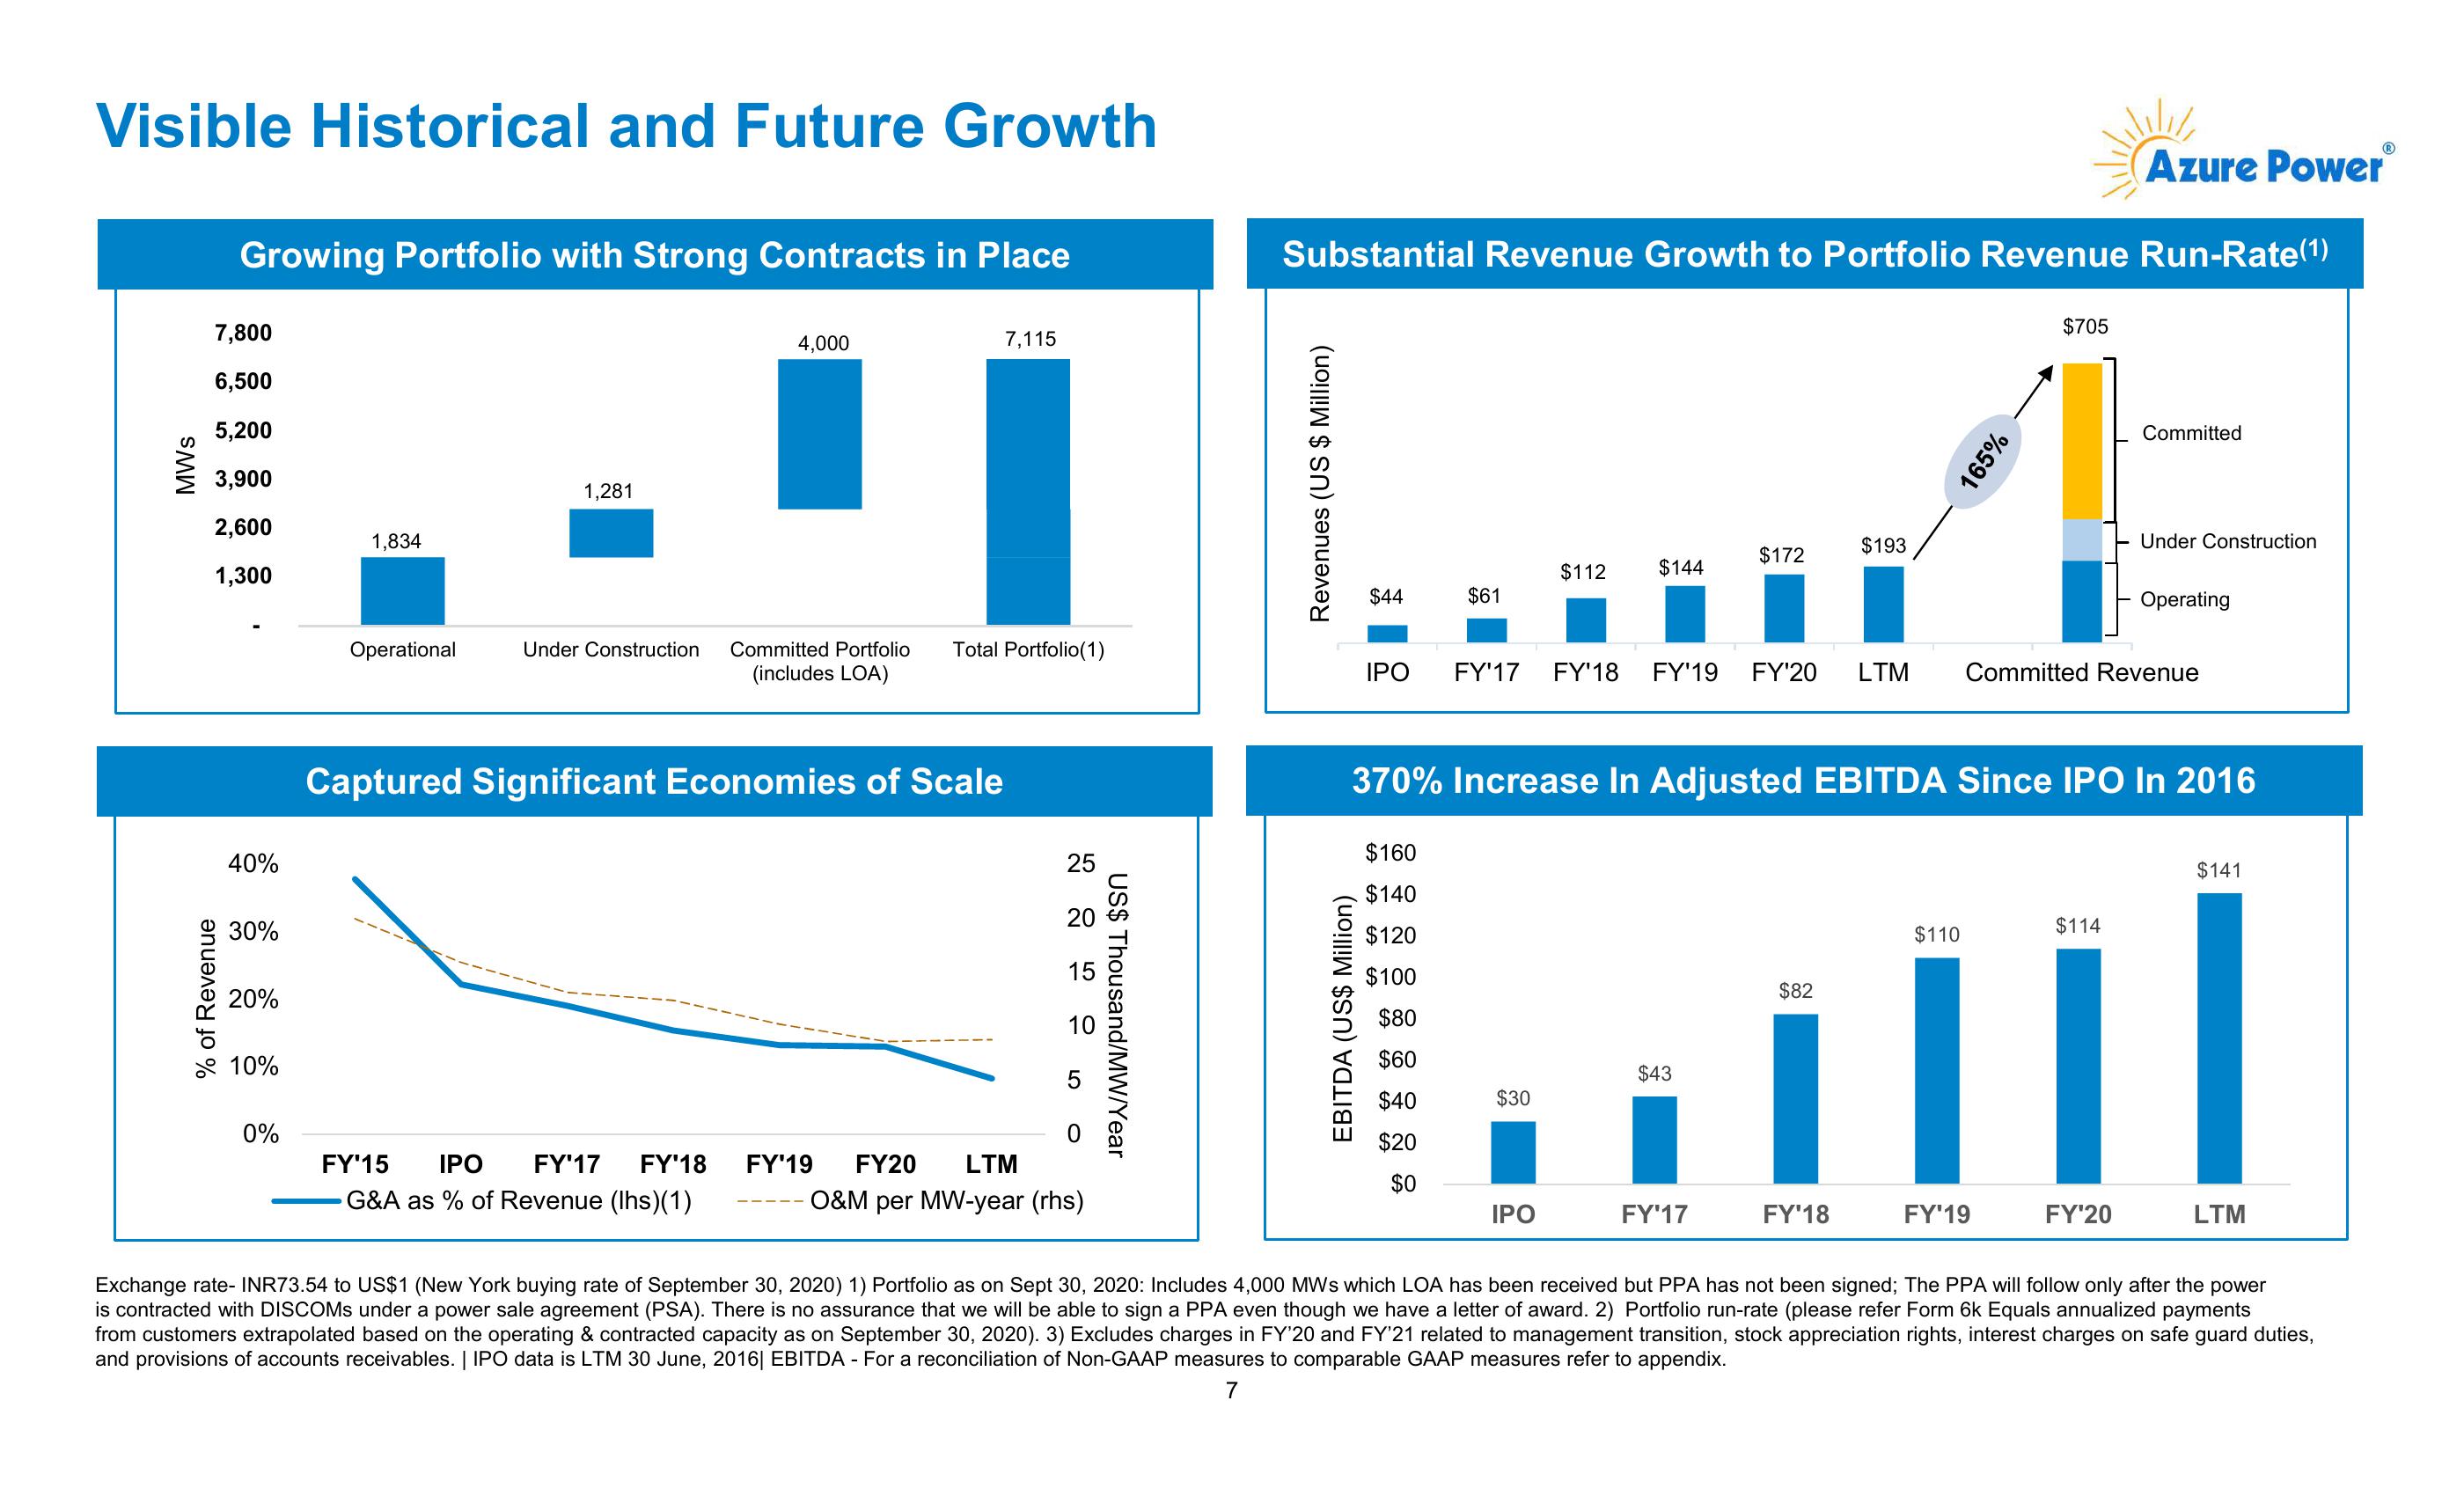
Visible Historical and Future Growth
Azure PowerⓇ
Substantial Revenue Growth to Portfolio Revenue Run-Rate (1)
SMW
% of Revenue
Growing Portfolio with Strong Contracts in Place
7,800
4,000
7,115
6,500
5,200
3,900
1,281
2,600
1,300
1,834
40%
30%
20%
10%
0%
Operational
Under Construction Committed Portfolio Total Portfolio(1)
(includes LOA)
Captured Significant Economies of Scale
15
10
225250
FY'15
IPO FY'17 FY'18 FY'19 FY20
G&A as % of Revenue (Ihs)(1)
LTM
O&M per MW-year (rhs)
US$ Thousand/MW/Year
Revenues (US $ Million)
EBITDA (US$ Million)
$193
$172
$112
$144
$44
$61
165%
$705
Committed
Under Construction
Operating
IPO FY'17 FY'18 FY'19 FY'20
LTM
Committed Revenue
370% Increase In Adjusted EBITDA Since IPO In 2016
$160
$140
$120
$100
$141
$114
$110
$82
$80
$60
$43
$40
$30
$20
$0
IPO
FY'17
FY'18
FY'19
FY'20
LTM
Exchange rate- INR73.54 to US$1 (New York buying rate of September 30, 2020) 1) Portfolio as on Sept 30, 2020: Includes 4,000 MWs which LOA has been received but PPA has not been signed; The PPA will follow only after the power
is contracted with DISCOMS under a power sale agreement (PSA). There is no assurance that we will be able to sign a PPA even though we have a letter of award. 2) Portfolio run-rate (please refer Form 6k Equals annualized payments
from customers extrapolated based on the operating & contracted capacity as on September 30, 2020). 3) Excludes charges in FY'20 and FY'21 related to management transition, stock appreciation rights, interest charges on safe guard duties,
and provisions of accounts receivables. | IPO data is LTM 30 June, 2016| EBITDA - For a reconciliation of Non-GAAP measures to comparable GAAP measures refer to appendix.
7View entire presentation