FIGS Results Presentation Deck
(unaudited)
Key Operating Metrics
2,047
Q2
Active Customers(¹)
(Trailing Twelve Months, in thousands)
2,154
Q3
2022
+21% YOY
2,294
Q4
2,390
Q1
2023
2,476
Q2
$109
Q2
Average Order Value
(AOV)(¹)
$112
Q3
2022
+6% YOY
$112
Q4
$114
Q1
2023
$115
Q2
Net Revenues Per Active
Customer (¹)
(Trailing Twelve Months)
(5%) YOY
$227
Q2
$227
Q3
2022
$221
Q4
$216
Q1
2023
OFIGS
$215
Q2
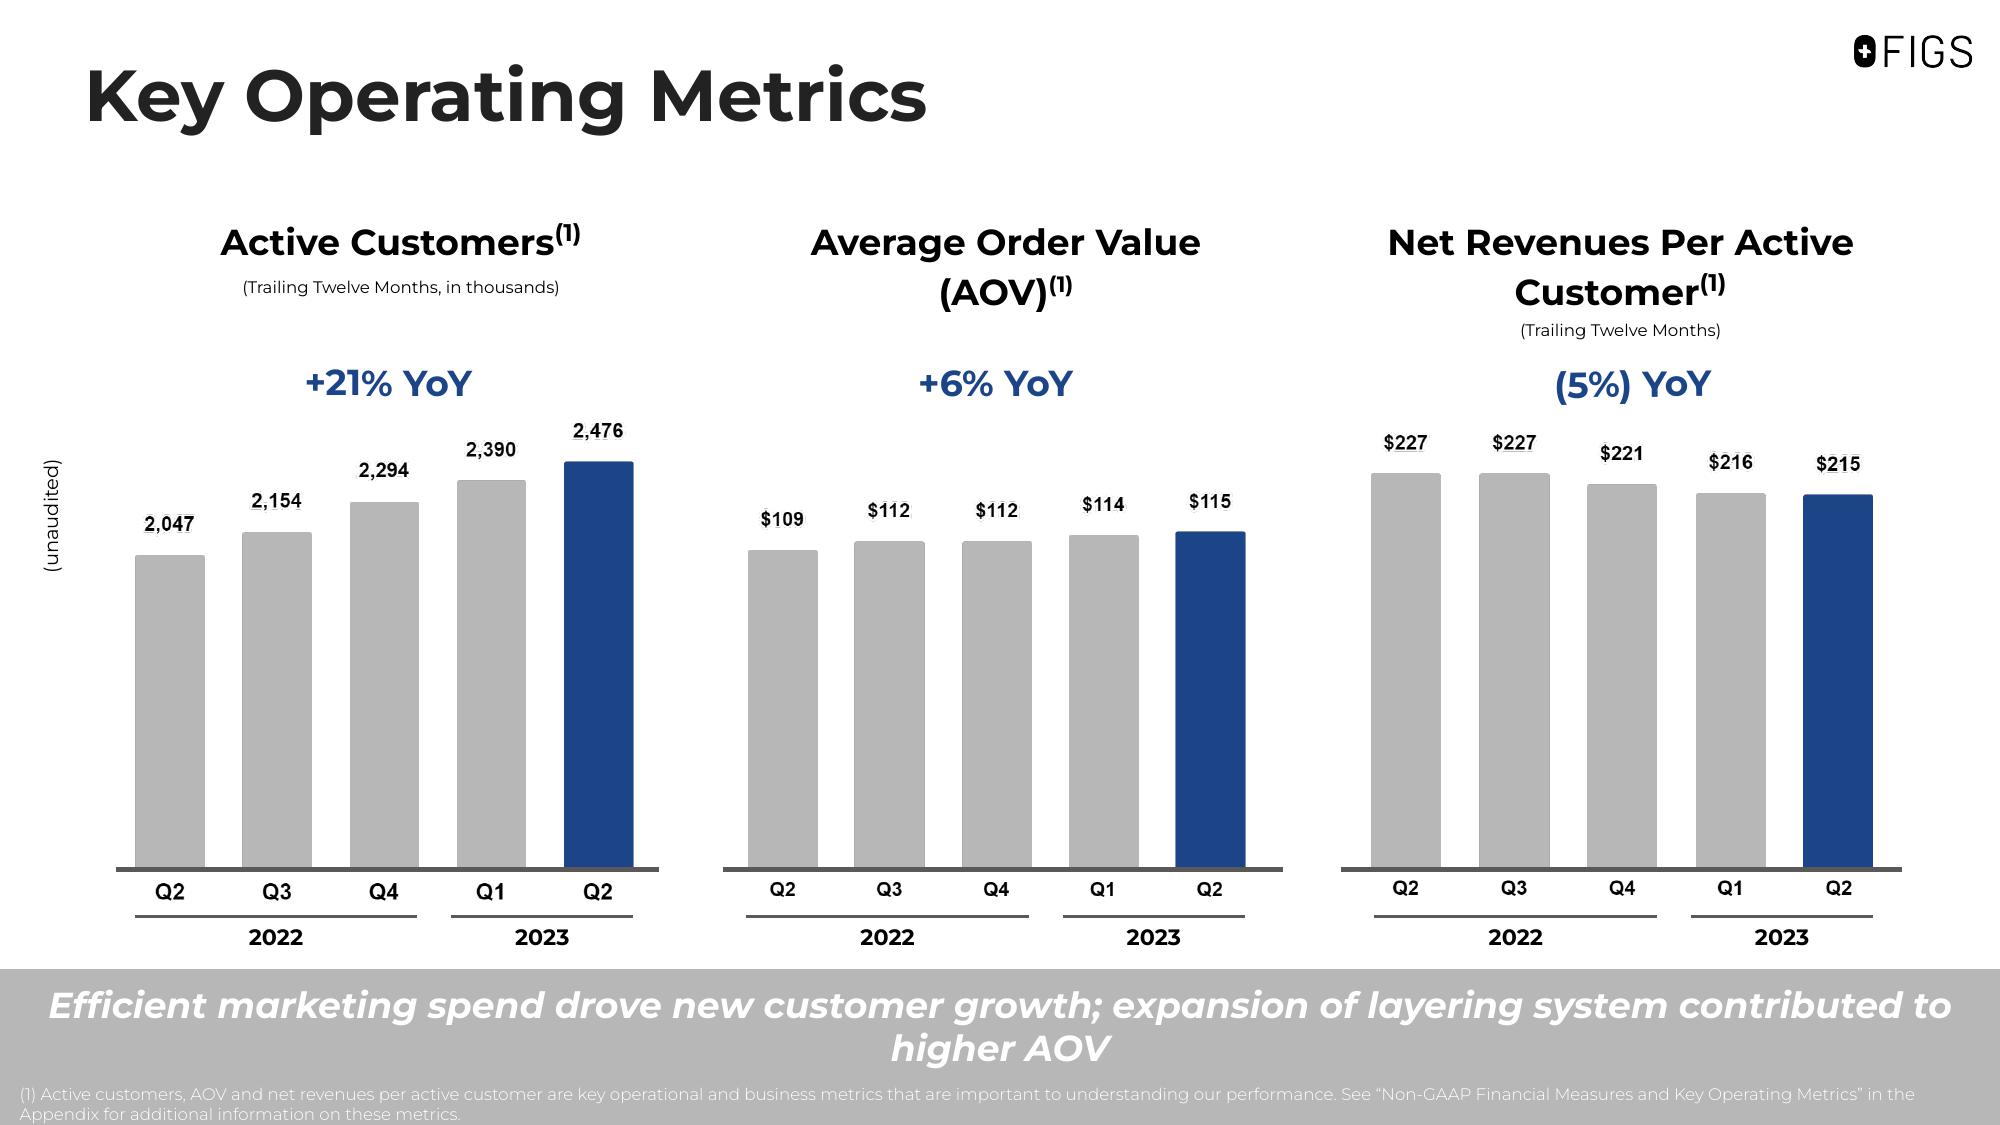
Efficient marketing spend drove new customer growth; expansion of layering system contributed to
higher AOV
(1) Active customers, AOV and net revenues per active customer are key operational and business metrics that are important to understanding our performance. See "Non-GAAP Financial Measures and Key Operating Metrics" in the
Appendix for additional information on these metrics.View entire presentation