AMC Mergers and Acquisitions Presentation Deck
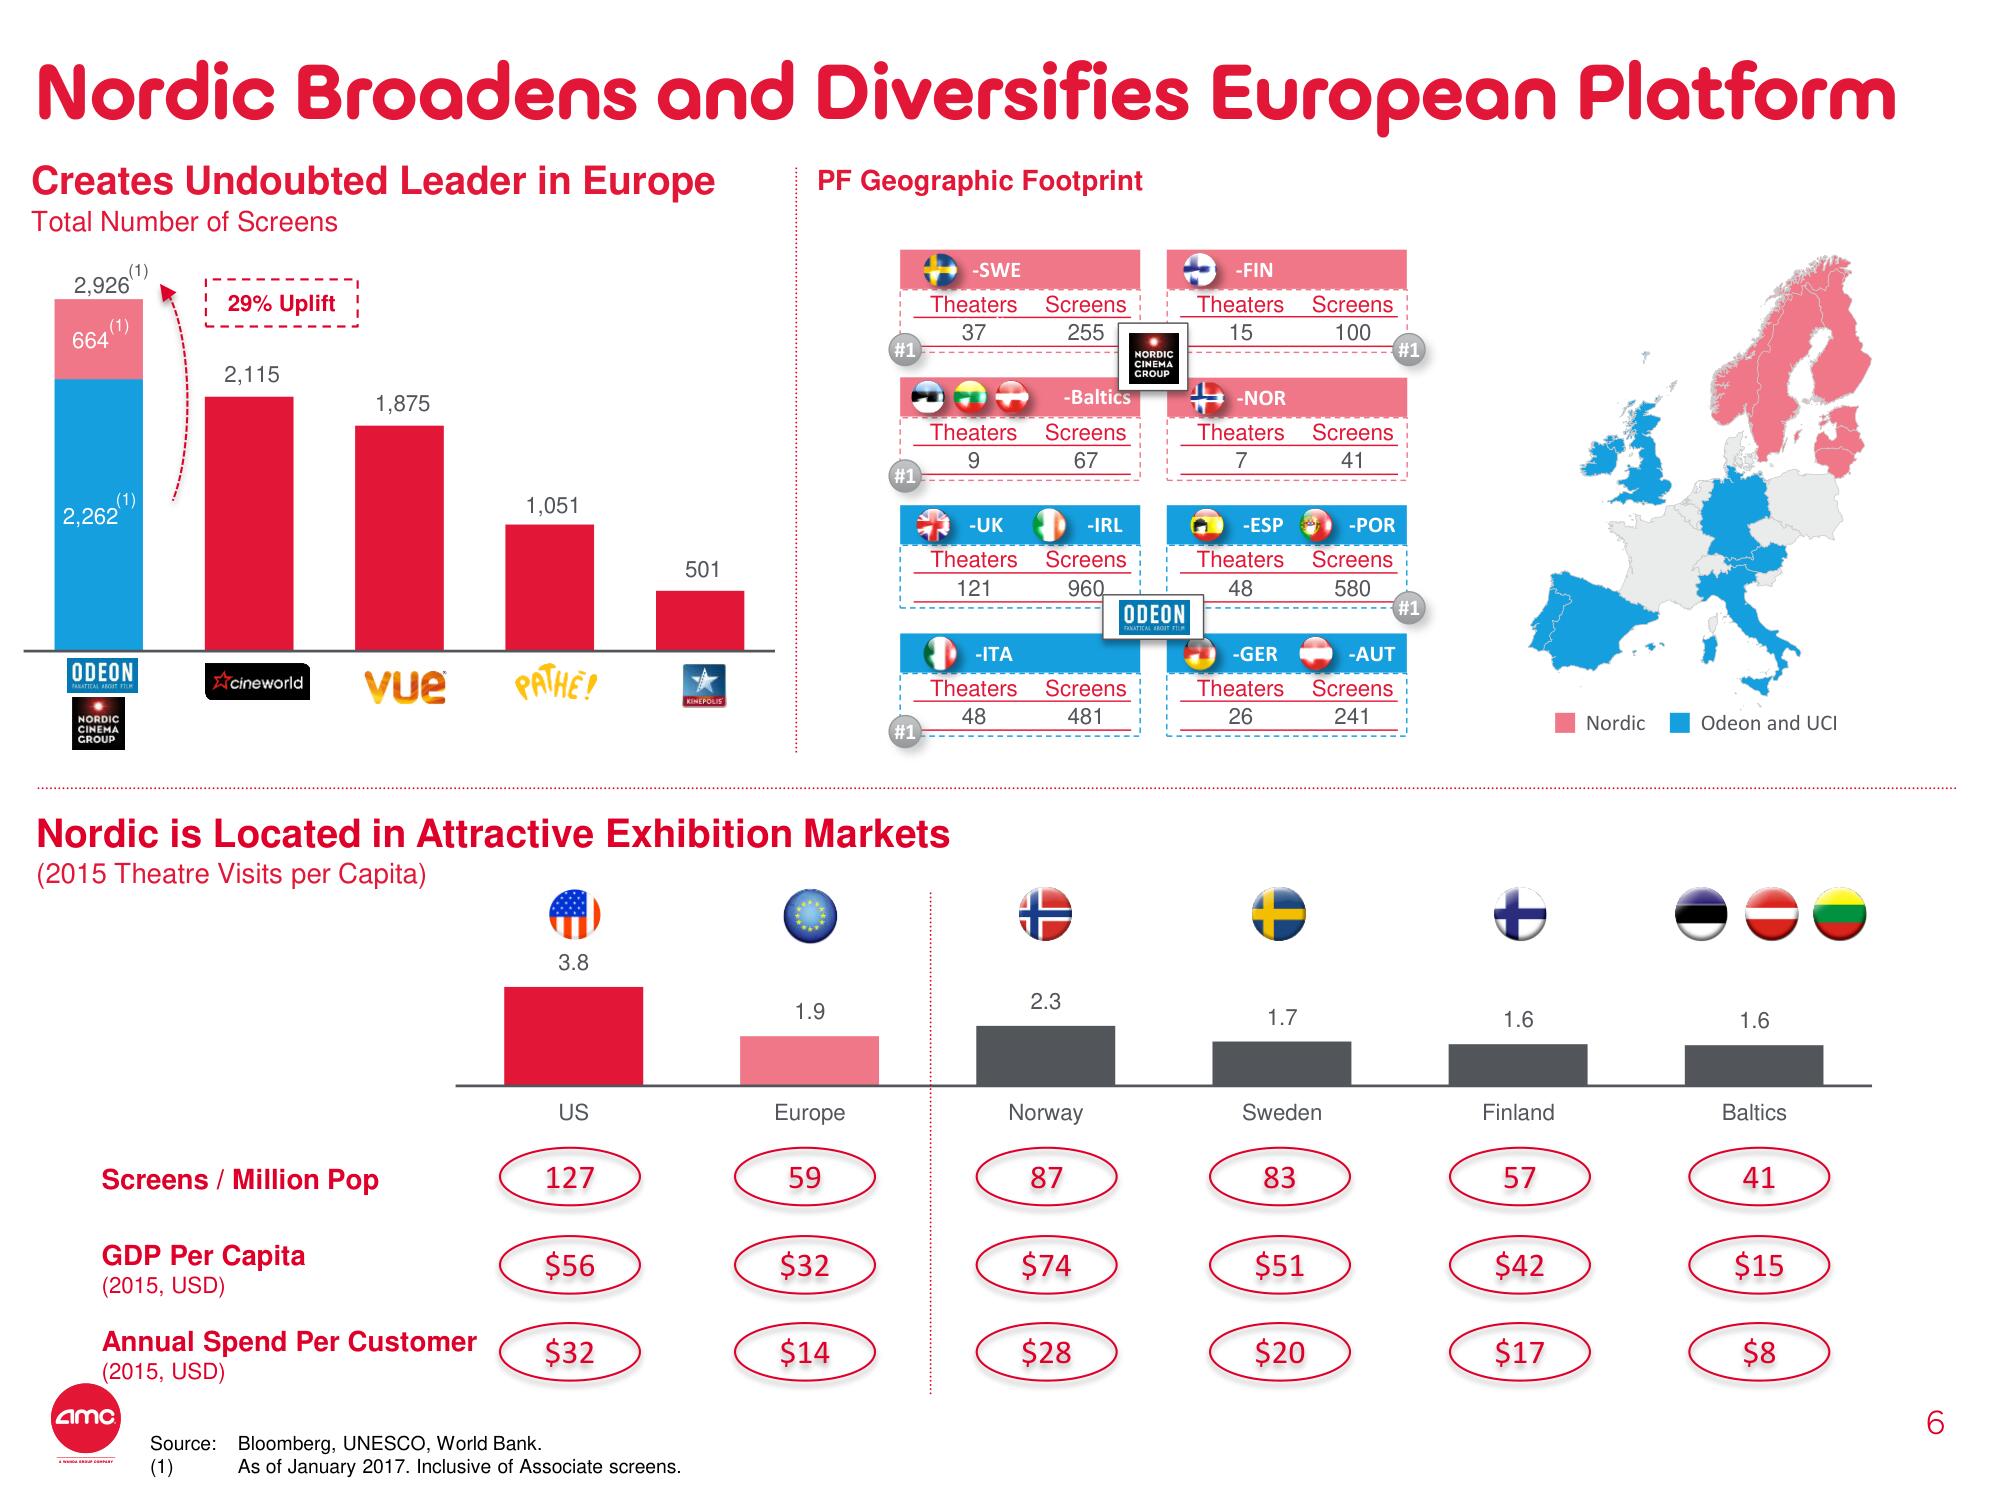
Nordic Broadens and Diversifies European Platform
Creates Undoubted Leader in Europe
PF Geographic Footprint
Total Number of Screens
2,926
664
(1)
(1)
2,262
ODEON
NORDIC
CINEMA
GROUP
29% Uplift
2,115
amc
1,875
cineworld Vue PATHE!
Screens / Million Pop
GDP Per Capita
(2015, USD)
1,051
Annual Spend Per Customer
(2015, USD)
Source: Bloomberg, UNESCO, World Bank.
(1)
3.8
US
127
$56
Nordic is Located in Attractive Exhibition Markets
(2015 Theatre Visits per Capita)
$32
501
As of January 2017. Inclusive of Associate screens.
KINEPOLIS
1.9
Europe
59
$32
#1
$14
#1
#1
-SWE
Theaters Screens
37
255
Theaters
9
-IRL
-UK
Theaters Screens
121
960
-ITA
Theaters
48
-Baltics
Screens
67
Screens
481
2.3
Norway
87
$74
$28
NORDIC
CINEMA
GROUP
ODEON
-FIN
Theaters Screens
15
100
-NOR
Theaters Screens
7
41
-ESP
Theaters
48
-GER
-AUT
Theaters Screens
26
241
1.7
Sweden
83
-POR
Screens
580
$51
$20
#1
#1
+
1.6
Finland
57
$42
$17
Nordic
Odeon and UCI
1.6
Baltics
41
$15
$8
(O
6View entire presentation