Pathward Financial Results Presentation Deck
INTEREST RATE RISK MANAGEMENT
DECEMBER 31, 2020
45%
35%
25%
15%
5%
-5%
12-MONTH INTEREST RATE SENSITIVITY FROM
BASE NET INTEREST INCOME
-100
+100
+200
Parallel Shock ■ Ramp
EARNING ASSET PRICING ATTRIBUTES ¹
41%
11%
Fixed Rate > 1 Year
Fixed Rate < 1 Year
24%
24%
+300
Floating or Variable
Federal Reserve Bank Deposits
(Floating or Variable)
Volume ($MM)
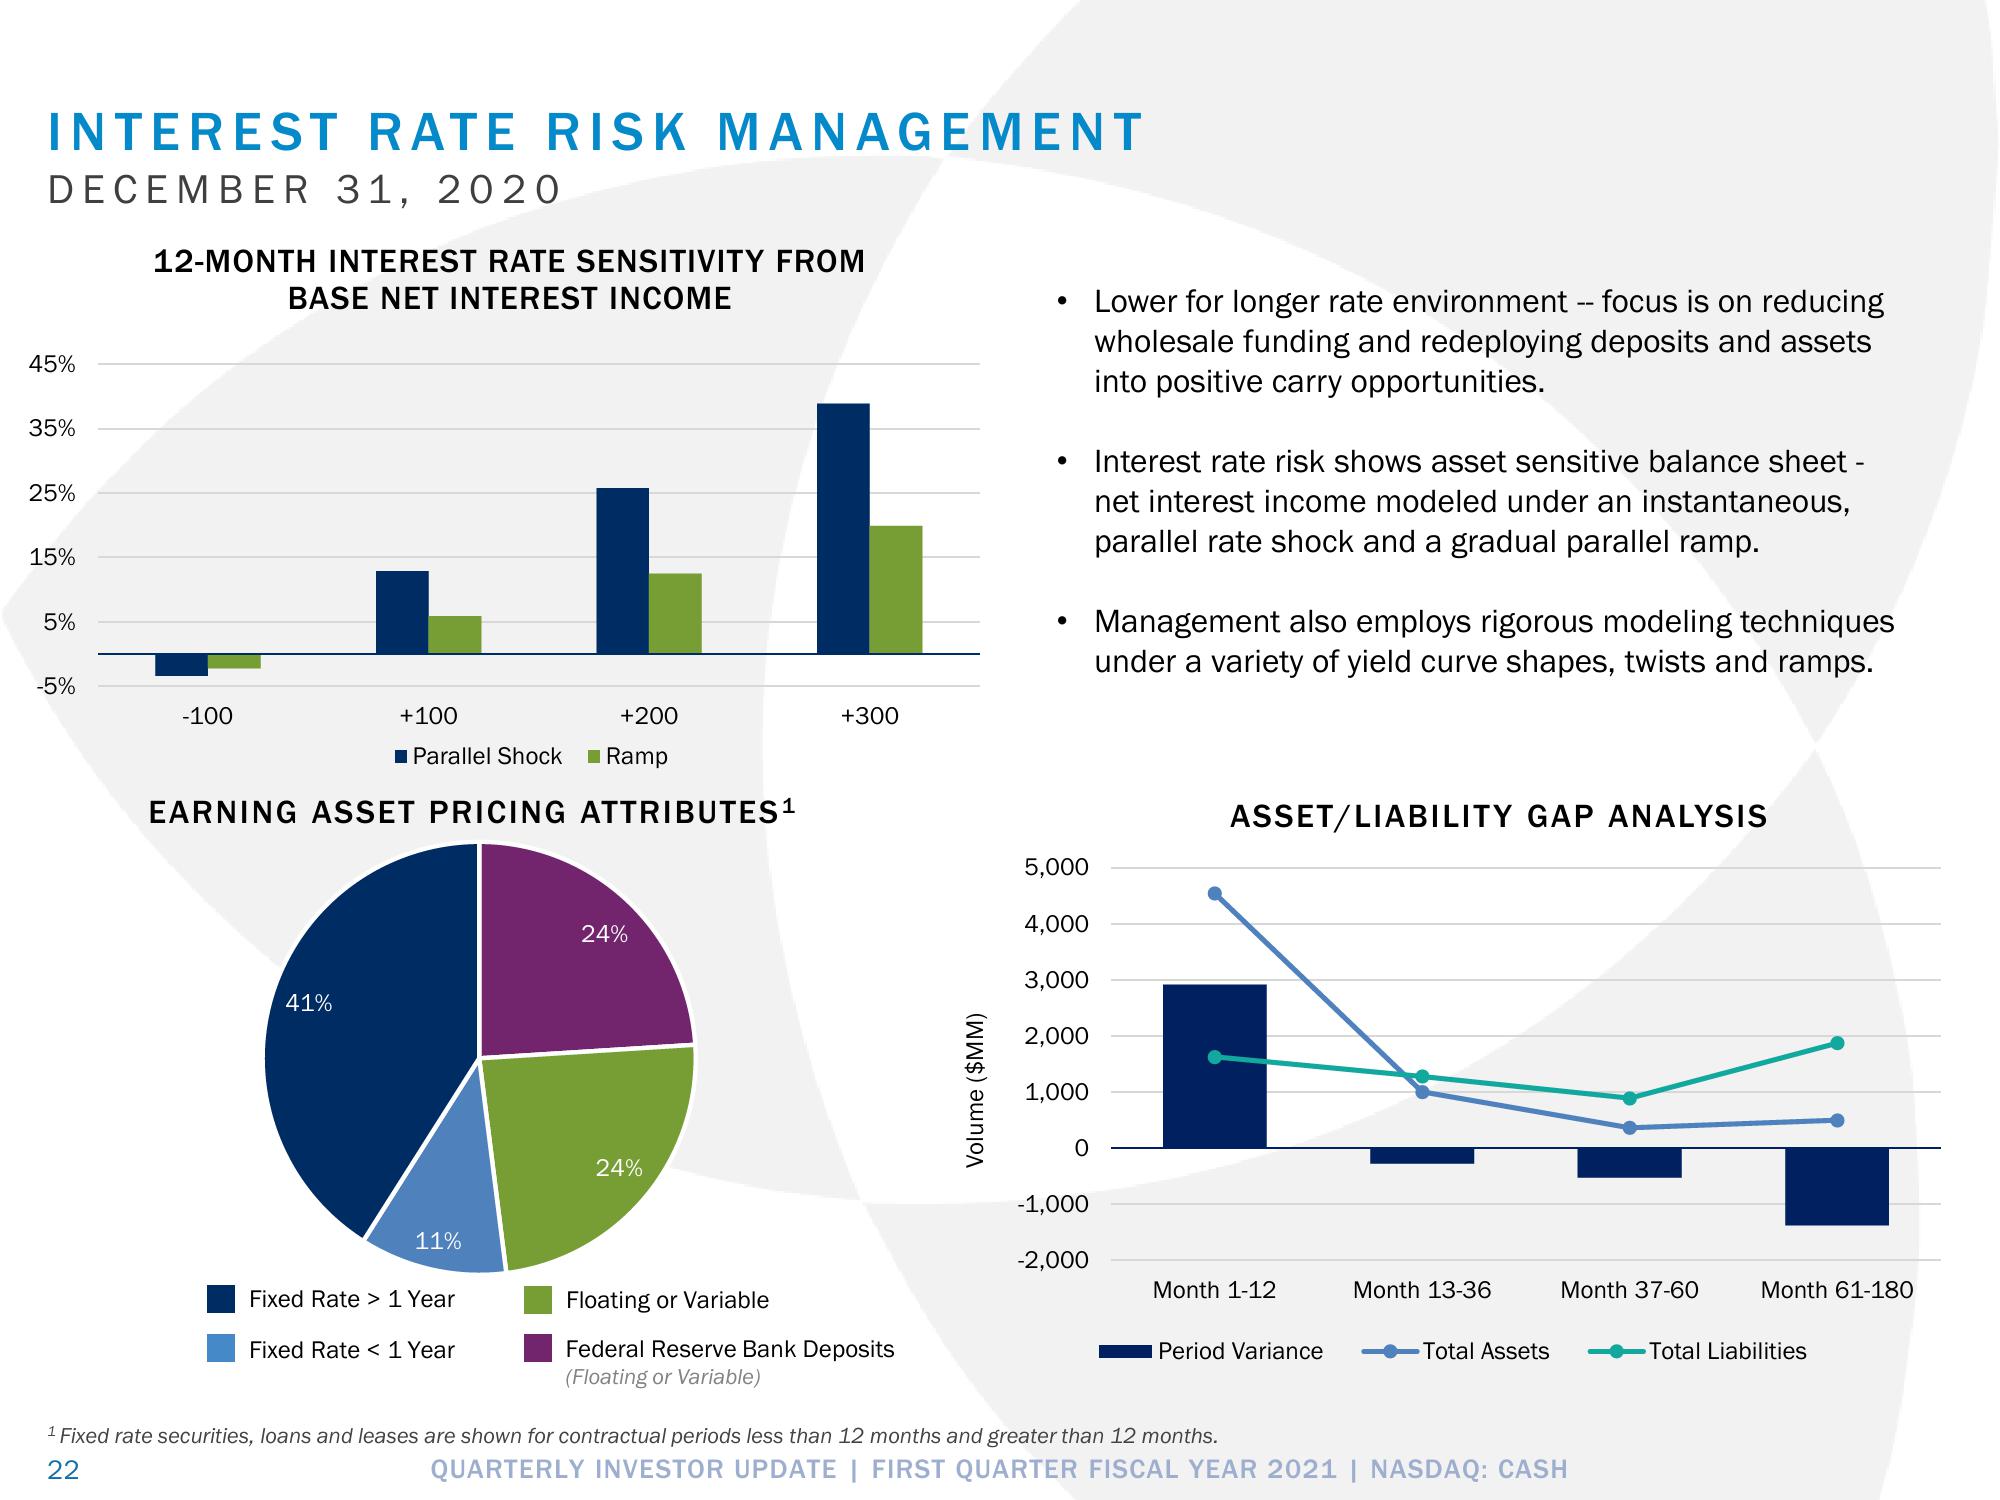
• Interest rate risk shows asset sensitive balance sheet -
net interest income modeled under an instantaneous,
parallel rate shock and a gradual parallel ramp.
5,000
4,000
3,000
2,000
1,000
O
-1,000
Lower for longer rate environment -- focus is on reducing
wholesale funding and redeploying deposits and assets
into positive carry opportunities.
-2,000
Management also employs rigorous modeling techniques
under a variety of yield curve shapes, twists and ramps.
ASSET/LIABILITY GAP ANALYSIS
Month 1-12
Period Variance
Month 13-36
Total Assets
Month 37-60
¹ Fixed rate securities, loans and leases are shown for contractual periods less than 12 months and greater than 12 months.
22
QUARTERLY INVESTOR UPDATE | FIRST QUARTER FISCAL YEAR 2021 | NASDAQ: CASH
Month 61-180
Total LiabilitiesView entire presentation