Marti Investor Presentation Deck
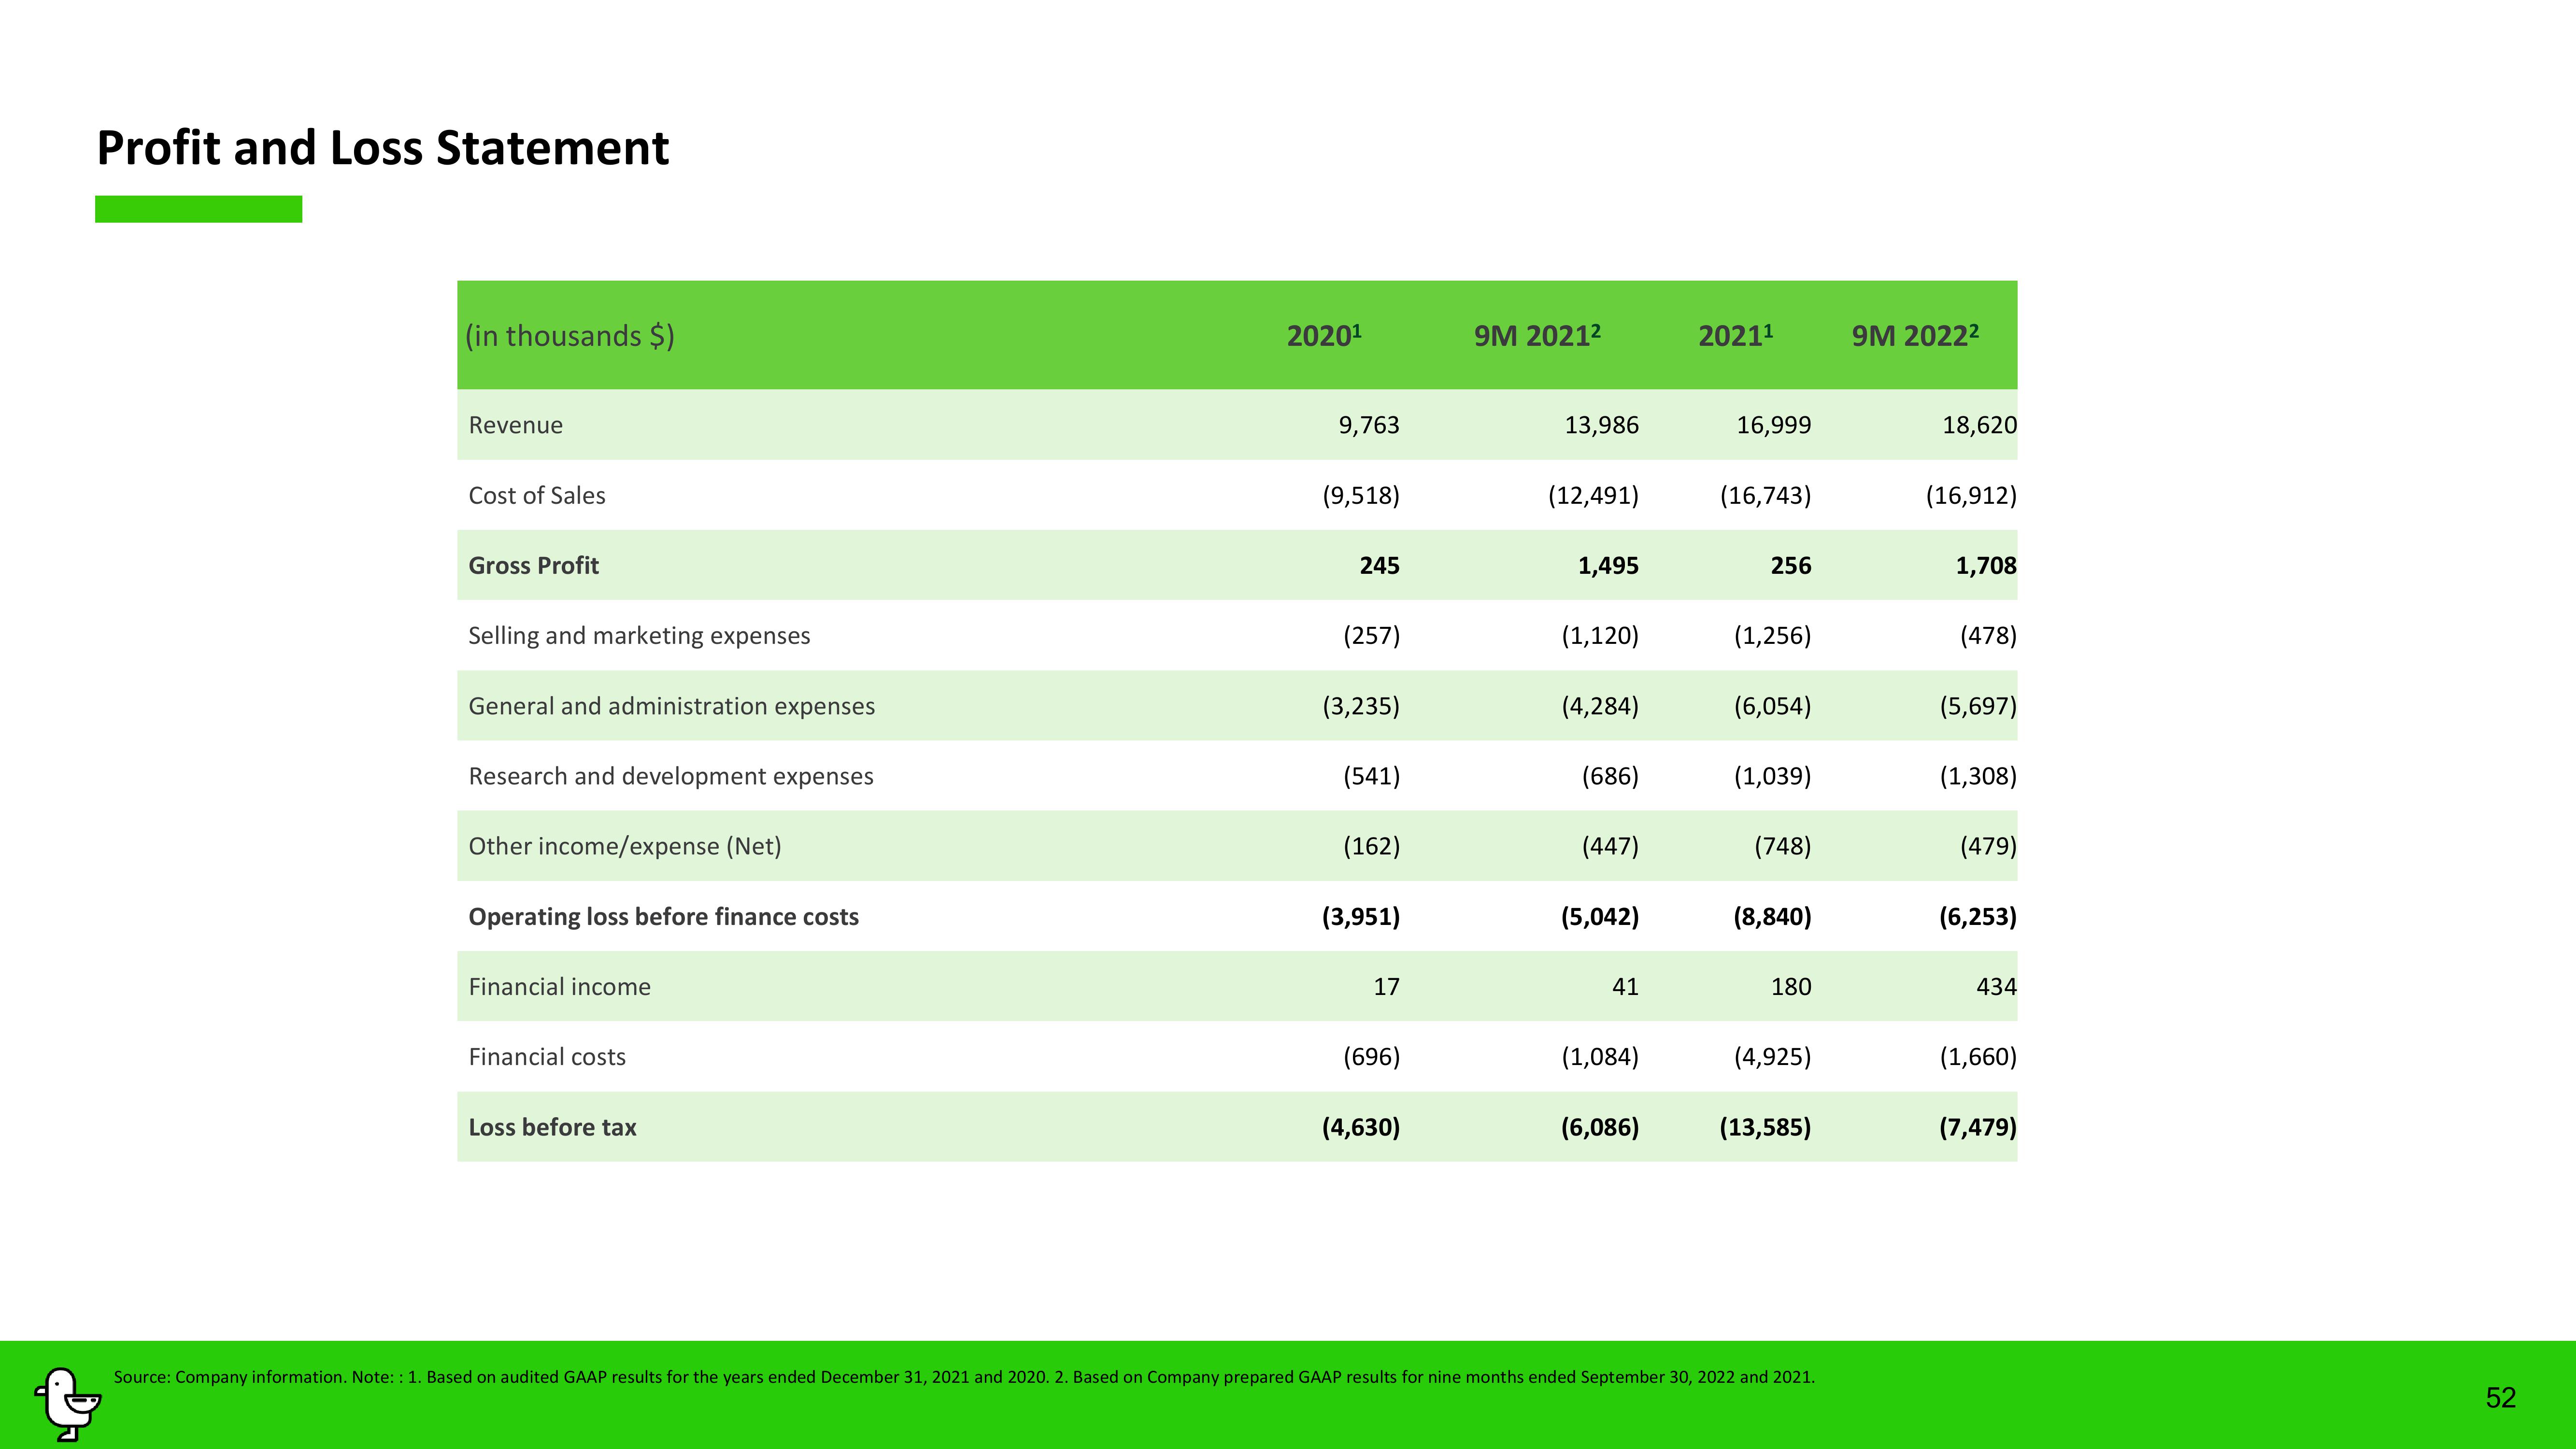
Profit and Loss Statement
(in thousands $)
Revenue
Cost of Sales
Gross Profit
Selling and marketing expenses
General and administration expenses
Research and development expenses
Other income/expense (Net)
Operating loss before finance costs
Financial income
Financial costs
Loss
tax
2020¹
9,763
(9,518)
245
(257)
(3,235)
(541)
(162)
(3,951)
17
(696)
(4,630)
9M 2021²
13,986
(12,491)
1,495
(1,120)
(4,284)
(686)
(447)
(5,042)
41
(1,084)
(6,086)
2021¹
16,999
(16,743)
256
(1,256)
(6,054)
(1,039)
(748)
(8,840)
180
(4,925)
(13,585)
Source: Company information. Note: : 1. Based on audited GAAP results for the years ended December 31, 2021 and 2020. 2. Based on Company prepared GAAP results for nine months ended September 30, 2022 and 2021.
9M 2022²
18,620
(16,912)
1,708
(478)
(5,697)
(1,308)
(479)
(6,253)
434
(1,660)
(7,479)
52View entire presentation