Netstreit Investor Presentation Deck
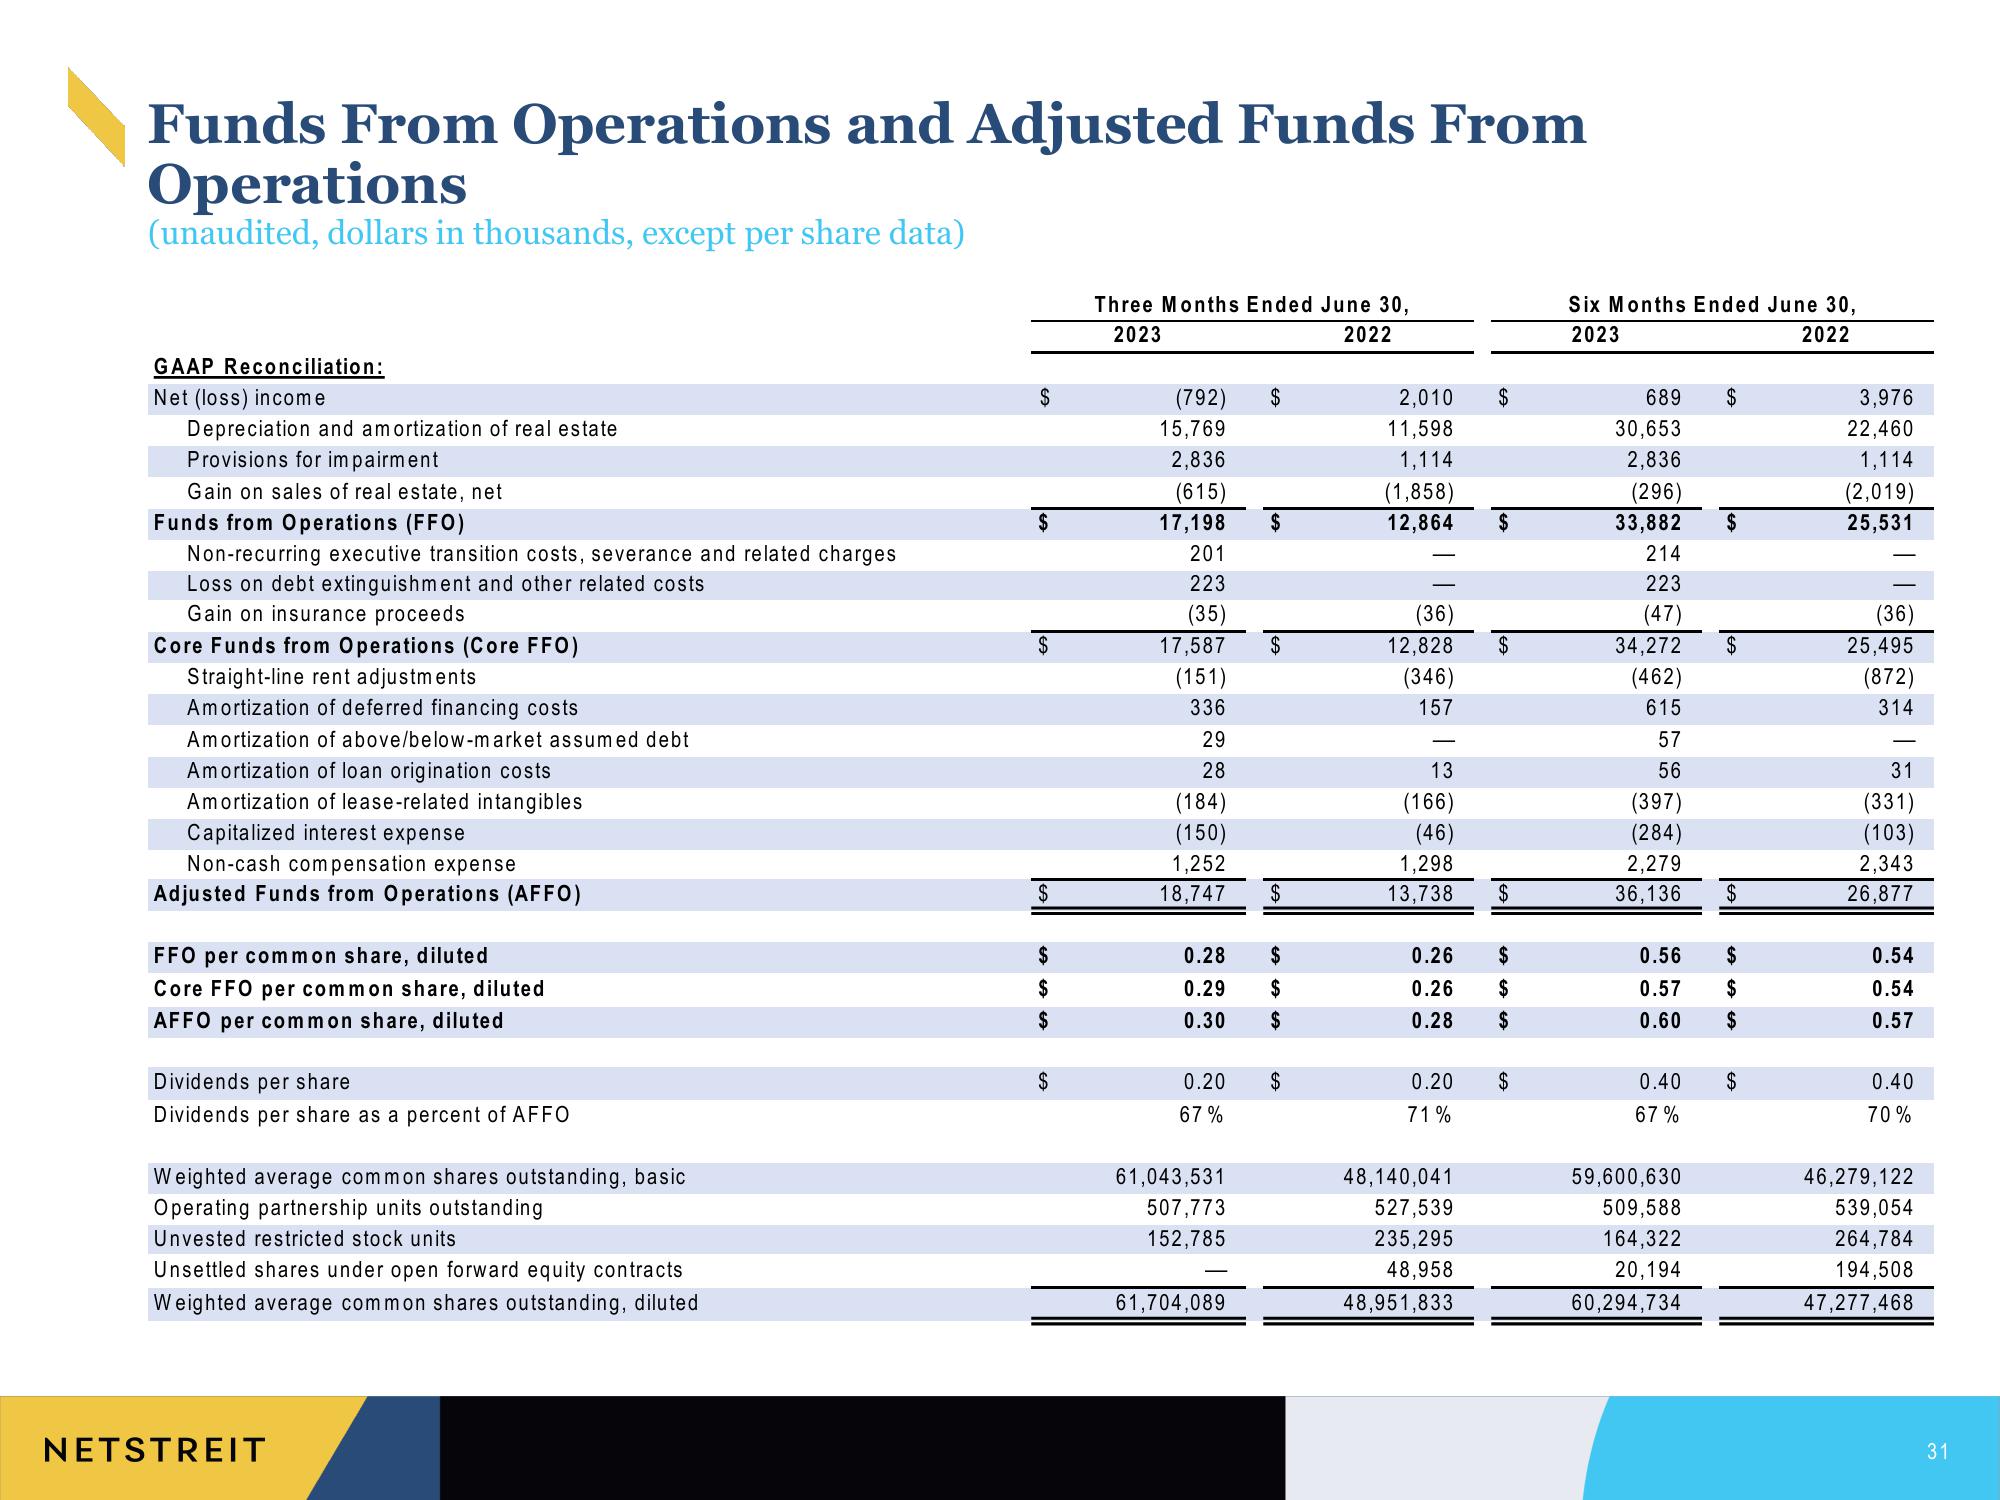
Funds From Operations and Adjusted Funds From
Operations
(unaudited, dollars in thousands, except per share data)
GAAP Reconciliation:
Net (loss) income
Depreciation and amortization of real estate
Provisions for impairment
Gain on sales of real estate, net
Funds from Operations (FFO)
Non-recurring executive transition costs, severance and related charges
Loss on debt extinguishment and other related costs
Gain on insurance proceeds
Core Funds from Operations (Core FFO)
Straight-line rent adjustments
Amortization of deferred financing costs
Amortization of above/below-market assumed debt
Amortization of loan origination costs
Amortization of lease-related intangibles
Capitalized interest expense
Non-cash compensation expense
Adjusted Funds from Operations (AFFO)
FFO per common share, diluted
Core FFO per common share, diluted
AFFO per common share, diluted
Dividends per share
Dividends per share as a percent of AFFO
Weighted average common shares outstanding, basic
Operating partnership units outstanding
Unvested restricted stock units
Unsettled shares under open forward equity contracts
Weighted average common shares outstanding, diluted
NETSTREIT
$
$
GA
$
$
$
$
$
$
Three Months Ended June 30,
2023
2022
(792) $
15,769
2,836
(615)
17,198 $
201
223
(35)
17,587
(151)
336
29
28
(184)
(150)
1,252
18,747
0.20
67%
0.28 $
0.29 $
0.30
$
61,043,531
507,773
152,785
$
61,704,089
$
$
2,010 $
11,598
1,114
(1,858)
12,864
(36)
12,828
(346)
157
13
(166)
(46)
1,298
13,738
0.26
0.26
0.28
0.20
71%
48,140,041
527,539
235,295
48,958
48,951,833
$
$
$
$
$
$
$
Six Months Ended June 30,
2023
2022
689 $
30,653
2,836
(296)
33,882
214
223
(47)
34,272
(462)
615
57
56
(397)
(284)
2,279
36,136
0.40
67%
$
59,600,630
509,588
164,322
20,194
60,294,734
$
0.56 $
0.57 $
0.60
$
$
$
3,976
22,460
1,114
(2,019)
25,531
(36)
25,495
(872)
314
31
(331)
(103)
2,343
26,877
0.54
0.54
0.57
0.40
70%
46,279,122
539,054
264,784
194,508
47,277,468
31View entire presentation