Informa Results Presentation Deck
All Divisions delivering Underlying Revenue Growth
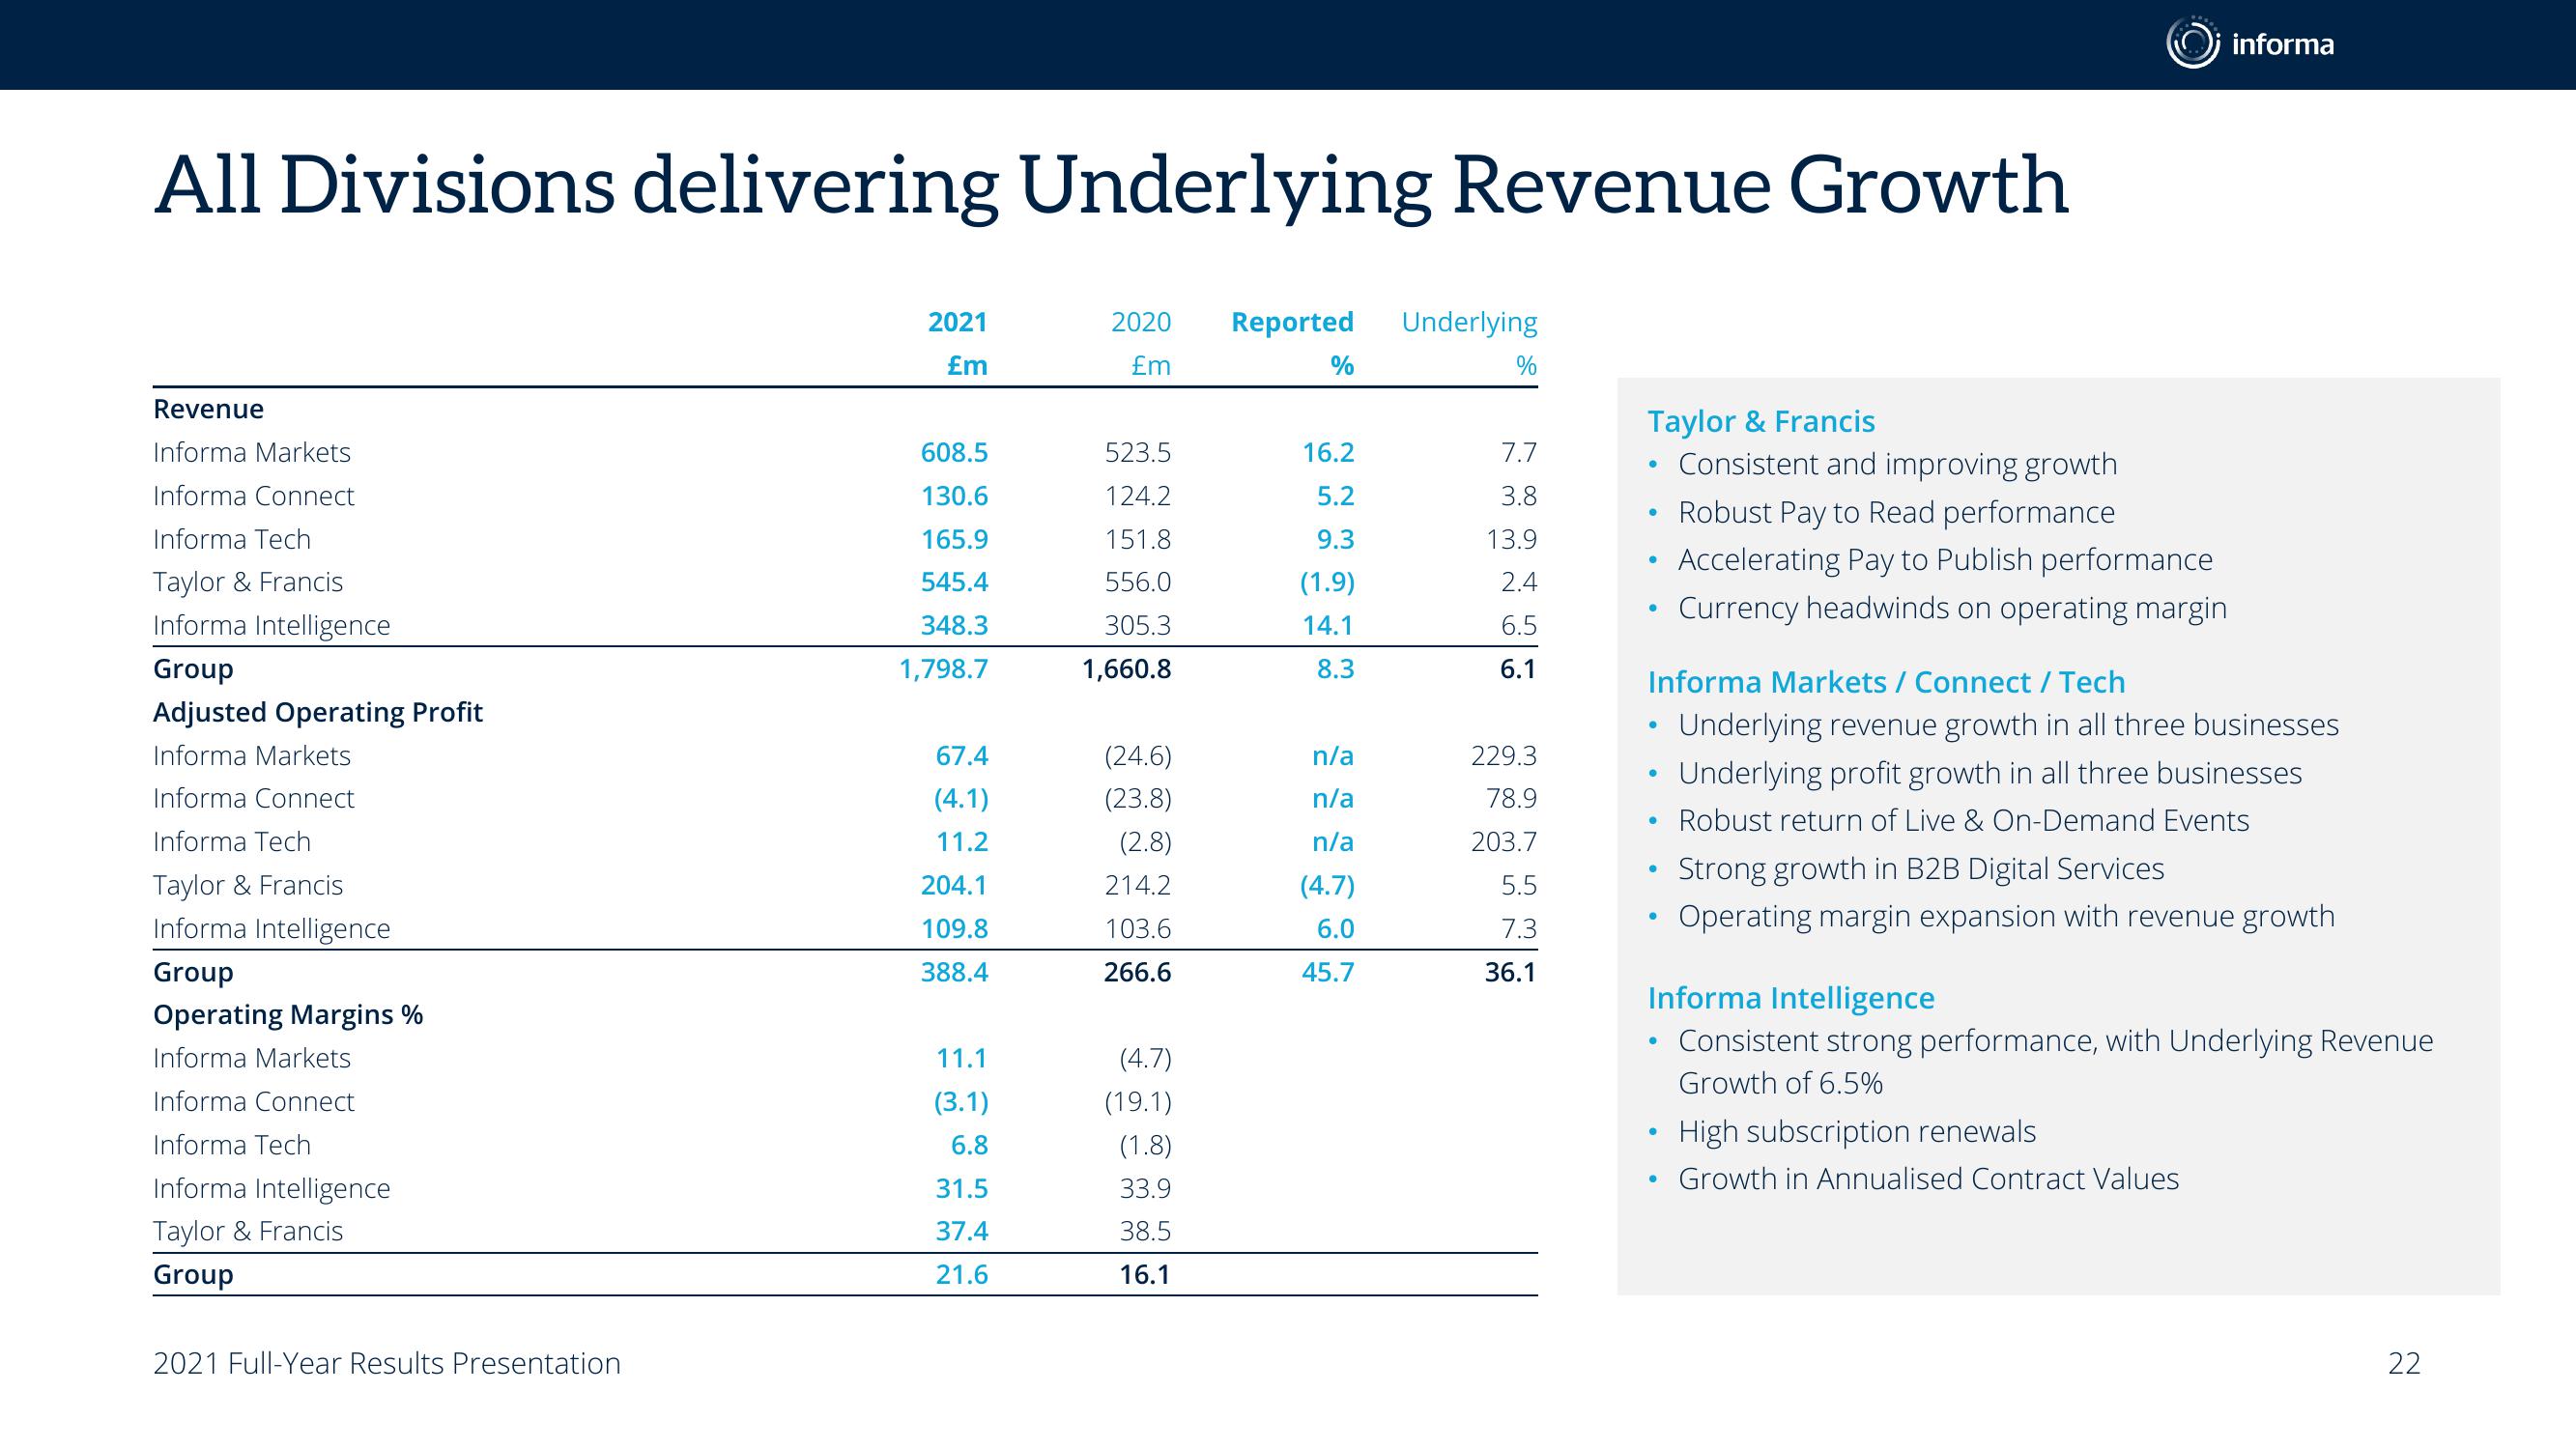
Revenue
Informa Markets
Informa Connect
Informa Tech
Taylor & Francis
Informa Intelligence
Group
Adjusted Operating Profit
Informa Markets
Informa Connect
Informa Tech
Taylor & Francis
Informa Intelligence
Group
Operating Margins %
Informa Markets
Informa Connect
Informa Tech
Informa Intelligence
Taylor & Francis
Group
2021 Full-Year Results Presentation
2021
£m
608.5
130.6
165.9
545.4
348.3
1,798.7
67.4
(4.1)
11.2
204.1
109.8
388.4
11.1
(3.1)
6.8
31.5
37.4
21.6
2020
£m
523.5
124.2
151.8
556.0
305.3
1,660.8
(24.6)
(23.8)
(2.8)
214.2
103.6
266.6
(4.7)
(19.1)
(1.8)
33.9
38.5
16.1
Reported Underlying
%
16.2
5.2
9.3
(1.9)
14.1
8.3
n/a
n/a
n/a
(4.7)
6.0
45.7
%
7.7
3.8
13.9
2.4
6.5
6.1
229.3
78.9
203.7
5.5
7.3
36.1
Taylor & Francis
Consistent and improving growth
•
Ⓡ
●
•
Informa Markets / Connect / Tech
Underlying revenue growth in all three businesses
Underlying profit growth in all three businesses
Robust return of Live & On-Demand Events
Strong growth in B2B Digital Services
Operating margin expansion with revenue growth
●
●
●
Robust Pay to Read performance
Accelerating Pay to Publish performance
Currency headwinds on operating margin
●
Informa Intelligence
Consistent strong performance, with Underlying Revenue
Growth of 6.5%
●
informa
High subscription renewals
Growth in Annualised Contract Values
22View entire presentation