Credit Suisse Investment Banking Pitch Book
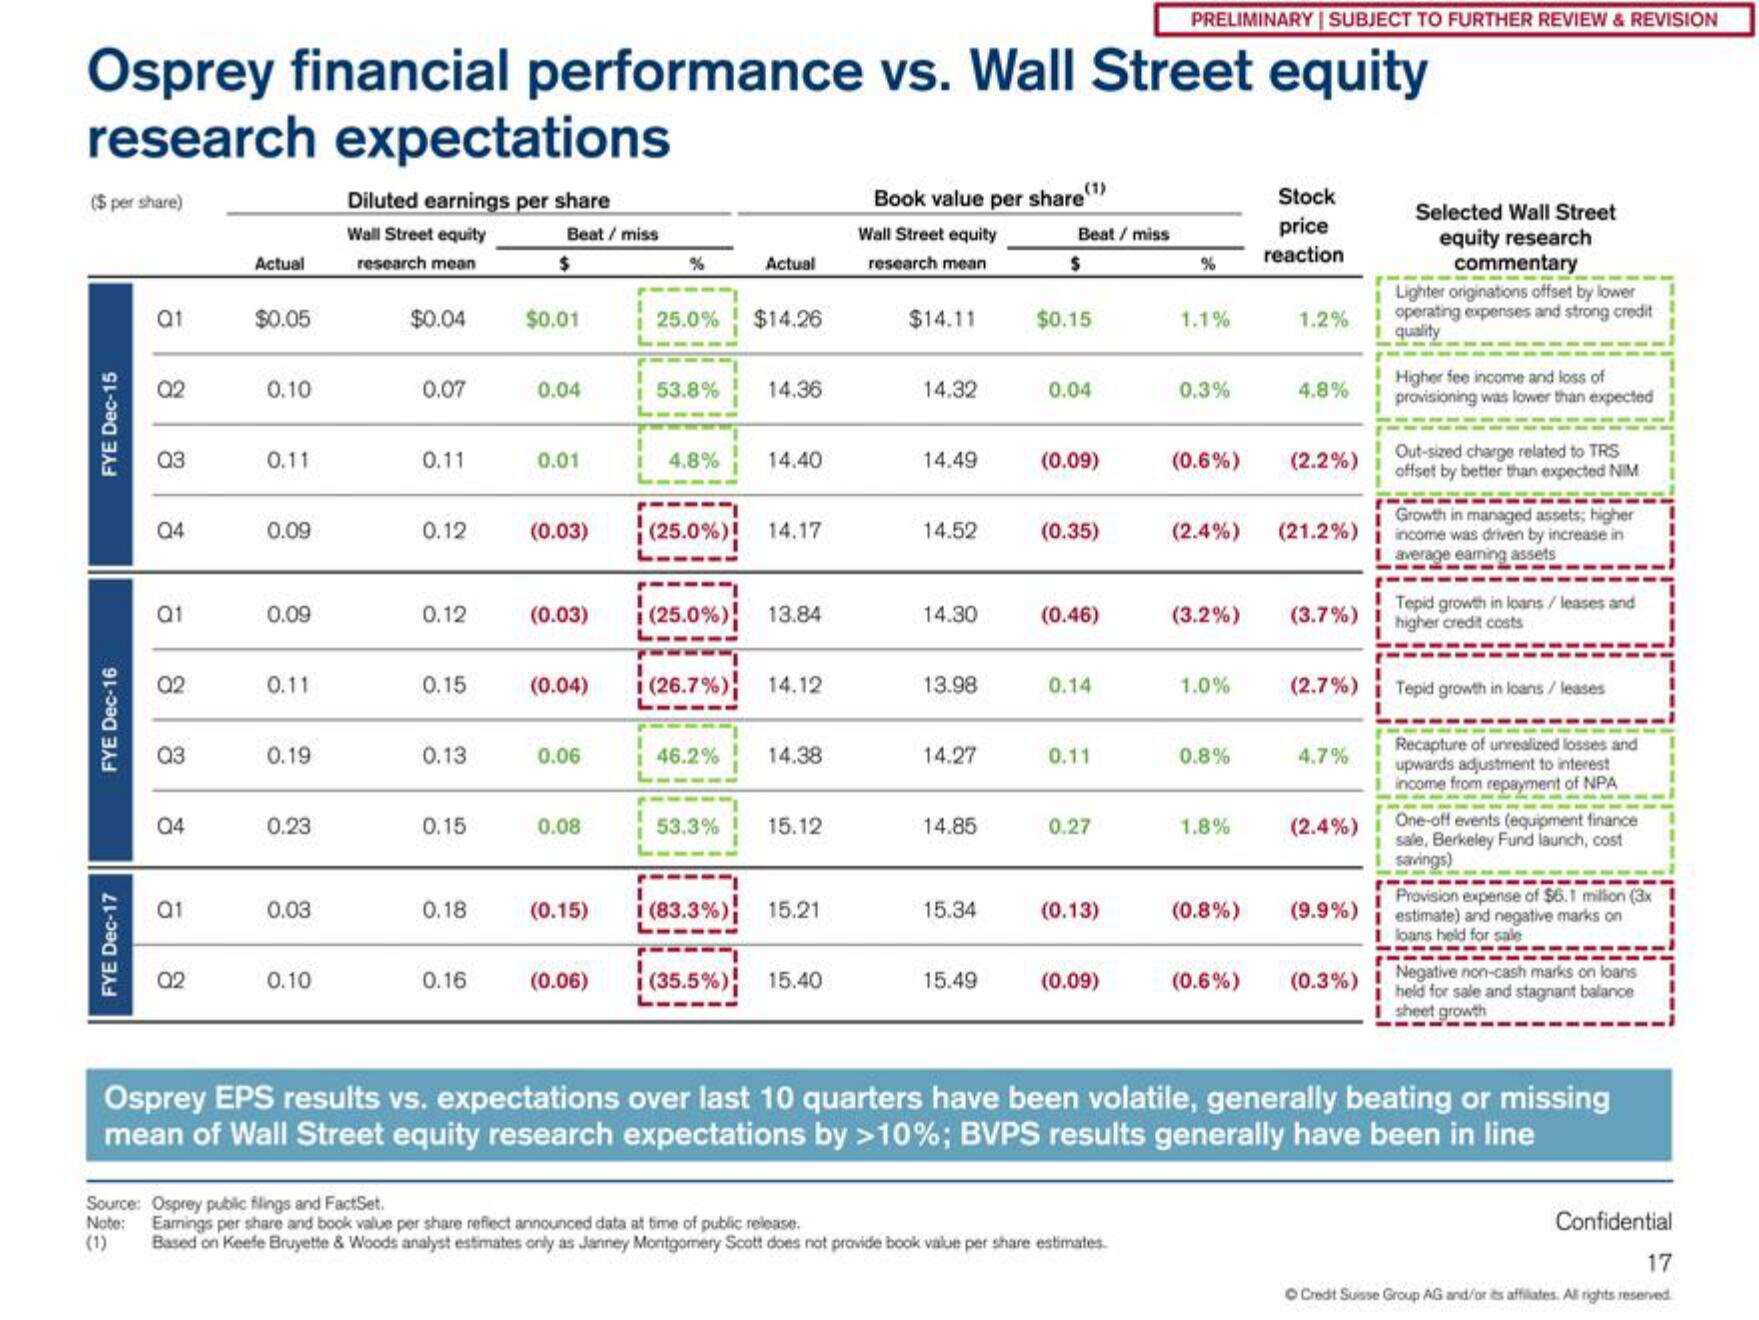
Osprey financial performance vs. Wall Street equity
research expectations
($ per share)
FYE Dec-15
FYE Dec-16
FYE Dec-17
Q1
02
Q3
Q4
Q1
Q2
Q3
Q4
Q1
02
Actual
$0.05
0.10
0.11
0.09
0.09
0.11
0.19
0.23
0.03
0.10
Diluted earnings per share
Wall Street equity
research mean
$0.04
0.07
0.11
0.12
0.12
0.15
0.13
0.15
0.18
0.16
Beat / miss
$
$0.01
0.04
0.01
(0.04)
0.06
0.08
%
(0.15)
25.0%
(0.06)
53.8%
4.8%
(0.03) (25.0%) 14.17
(0.03) (25.0%) 13.84
i (26.7%)
Actual
i 46.2%
$14.26
53.3%
14.36
14.40
14.12
14.38
15.12
(83.3%) 15.21
(35.5%) 15.40
(1)
Book value per share
Wall Street equity
research mean
$14.11
14.32
14.49
14.52
14.30
13.98
14.27
14.85
15.34
15.49
Beat / miss
$
$0.15
0.04
(0.09)
(0.35)
(0.46)
0.14
0.11
0.27
(0.13)
(0.09)
PRELIMINARY | SUBJECT TO FURTHER REVIEW & REVISION
Source: Osprey public flings and FactSet.
Note: Earnings per share and book value per share reflect announced data at time of public release.
(1)
Based on Keefe Bruyette & Woods analyst estimates only as Janney Montgomery Scott does not provide book value per share estimates.
1.1%
0.3%
(0.6%)
(3.2%)
1.0%
0.8%
(2.4%) (21.2%)
1.8%
Stock
price
reaction
(0.8%)
1.2%
4.8%
(2.2%)
(3.7%)
(2.7%)
4.7%
(2.4%)
(9.9%)
(0.6%) (0.3%)
Selected Wall Street
equity research
commentary
Lighter originations offset by lower
i operating expenses and strong credit
quality
Higher fee income and loss of
provisioning was lower than expected
Out-sized charge related to TRS
offset by better than expected NIM
Growth in managed assets; higher
income was driven by increase in
average eaming assets
Tepid growth in loans/leases and
higher credit costs
Tepid growth in loans / leases
Recapture of unrealized losses and
upwards adjustment to interest
income from repayment of NPA
One-off events (equipment finance
sale, Berkeley Fund launch, cost
savings)
Provision expense of $6.1 million (3x
estimate) and negative marks on
loans held for sale
Negative non-cash marks on loans
held for sale and stagnant balance
sheet growth
Osprey EPS results vs. expectations over last 10 quarters have been volatile, generally beating or missing
mean of Wall Street equity research expectations by >10%; BVPS results generally have been in line
Confidential
17
Ⓒ Credit Suisse Group AG and/or its affiliates. All rights reserved.View entire presentation