Silicon Valley Bank Results Presentation Deck
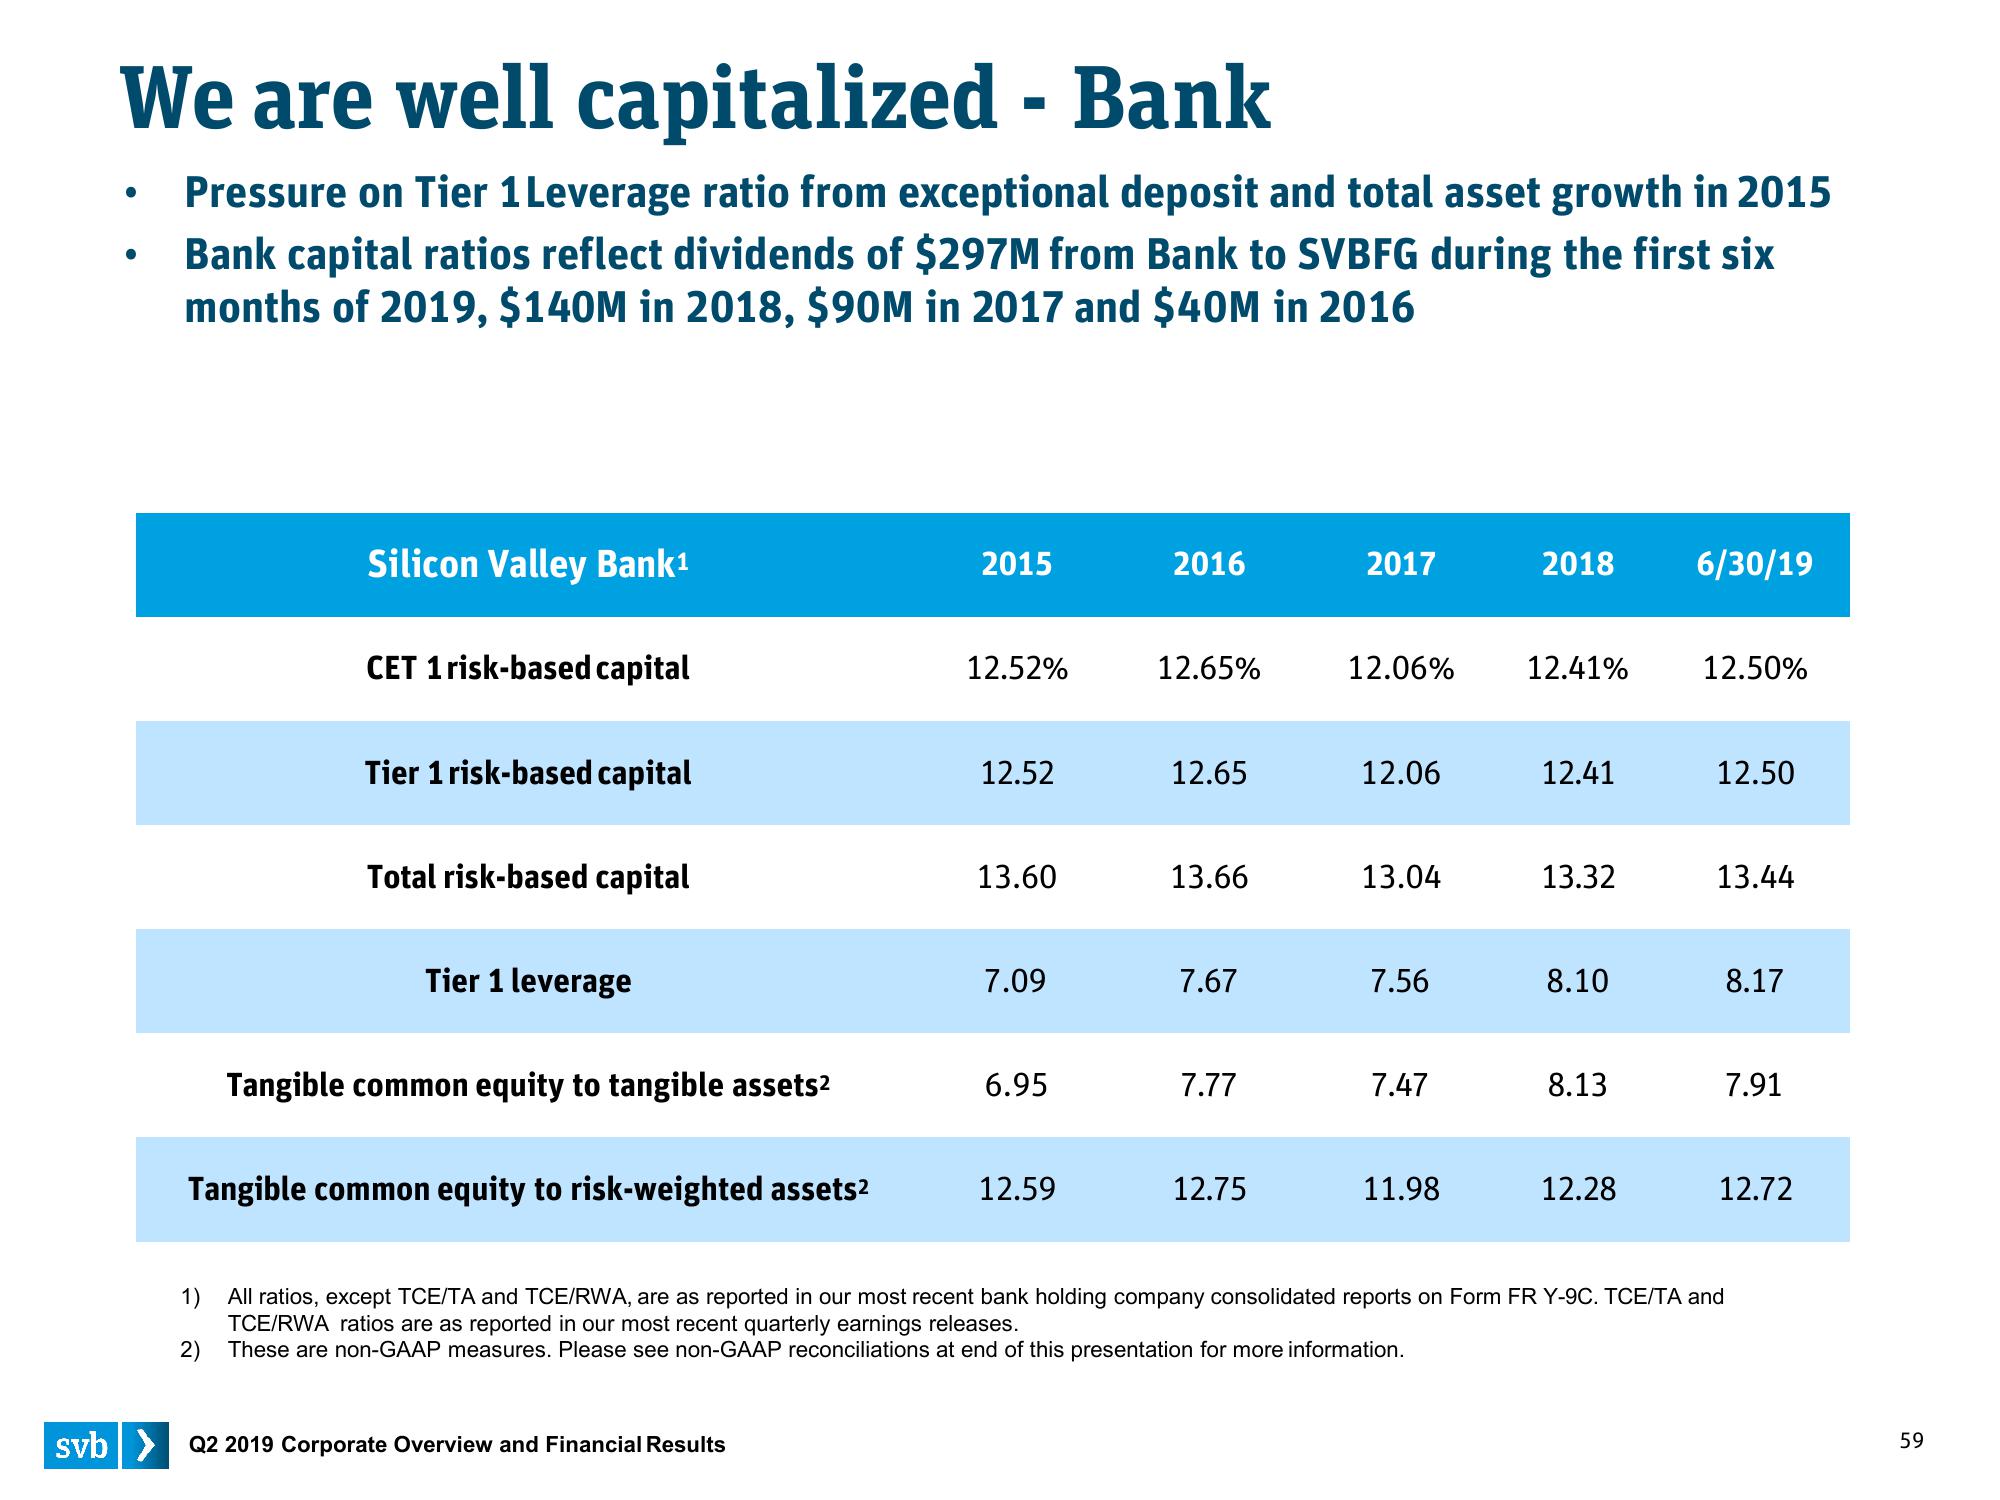
We are well capitalized - Bank
Pressure on Tier 1 Leverage ratio from exceptional deposit and total asset growth in 2015
Bank capital ratios reflect dividends of $297M from Bank to SVBFG during the first six
months of 2019, $140M in 2018, $90M in 2017 and $40M in 2016
●
●
Silicon Valley Bank¹
CET 1 risk-based capital
Tier 1 risk-based capital
Total risk-based capital
Tier 1 leverage
Tangible common equity to tangible assets²
Tangible common equity to risk-weighted assets²
2015
svb> Q2 2019 Corporate Overview and Financial Results
12.52%
12.52
13.60
7.09
6.95
12.59
2016
12.65%
12.65
13.66
7.67
7.77
12.75
2017
12.06%
12.06
13.04
7.56
7.47
11.98
2018 6/30/19
12.41%
12.41
13.32
8.10
8.13
12.28
12.50%
12.50
13.44
1)
All ratios, except TCE/TA and TCE/RWA, are as reported in our most recent bank holding company consolidated reports on Form FR Y-9C. TCE/TA and
TCE/RWA ratios are as reported in our most recent quarterly earnings releases.
2)
These are non-GAAP measures. Please see non-GAAP reconciliations at end of this presentation for more information.
8.17
7.91
12.72
59View entire presentation