ironSource SPAC
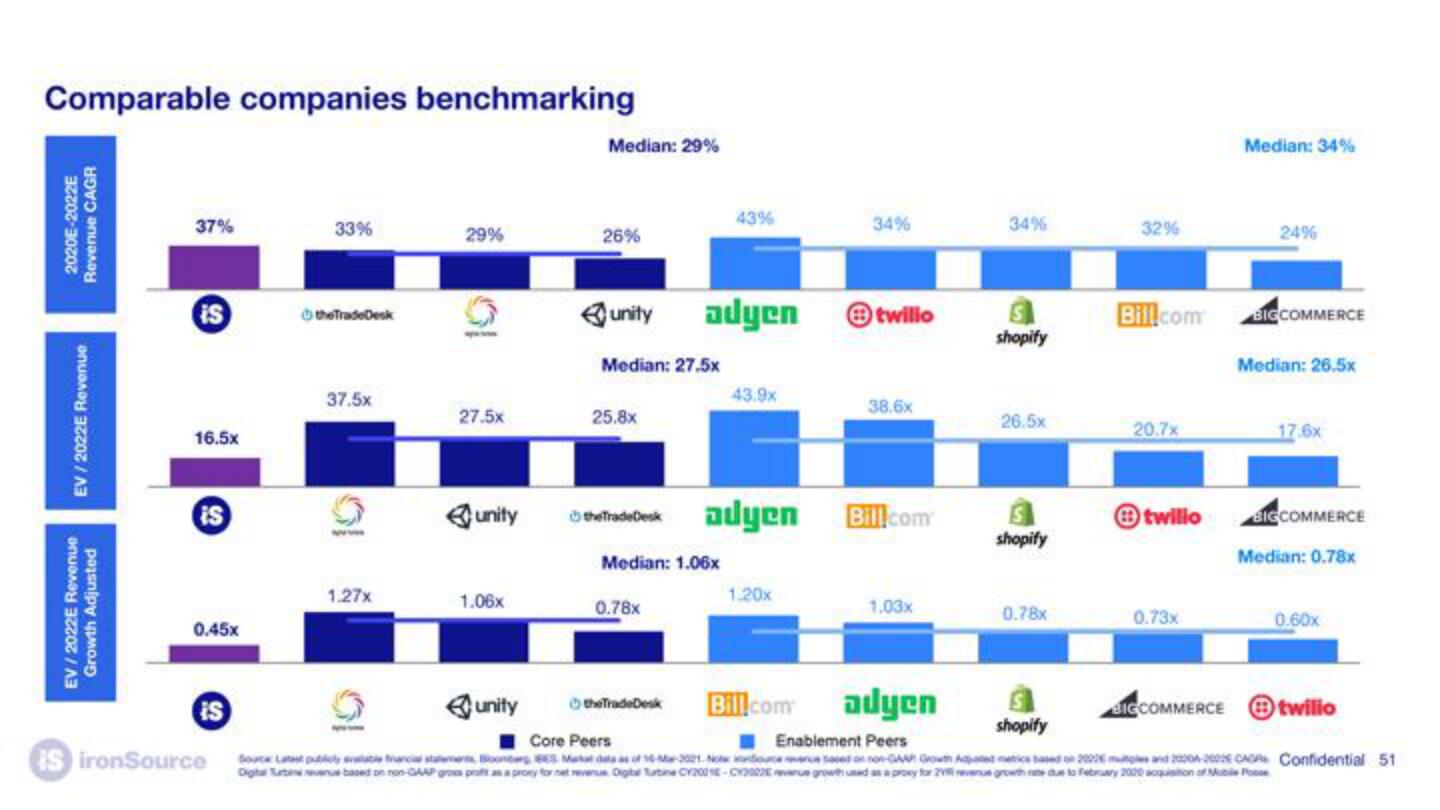
Comparable companies benchmarking
2020E-2022E
Revenue CAGR
EV/2022E Revenue
EV/2022E Revenue
Growth Adjusted
37%
is
16.5x
is
0.45x
is
33%
the TradeDesk
37.5×
1.27x
29%
27.5x
unity
1.06x
unity
Median: 29%
26%
unity
Median: 27.5x
25.8x
43%
0.78x
adyen twilio
43.9x
the TradeDesk adyen
Median: 1.06x
1.20x
34%
the TradeDesk Bill.com
38.6x
Bill.com
1.03x
adyen
34%
shopify
26.5×
shopify
0.78x
32%
Bill.com
20.7x
twilio
0.73x
BIGCOMMERCE
Median: 34%
24%
BIGCOMMERCE
Median: 26.5x
17.6x
BIGCOMMERCE
Median: 0.78x
0.60x
twilio
shopify
Core Peers
Enablement Peers
IS ironSource Lab francial statements 3 Maka data as of 16-Mar-2001. Nec nource vence based on Growth Added matics based in and 2004 Confidential 51
Digha Tutvenue based on non-GAAP gross proft as a proxy for net revenus Digital Turbine CY2001-C2022 venue growth used as a proxy for 2 revenue growth rate due to February 2000 acquisition of Mabile PoseView entire presentation