Experian Investor Presentation Deck
Executive Summary
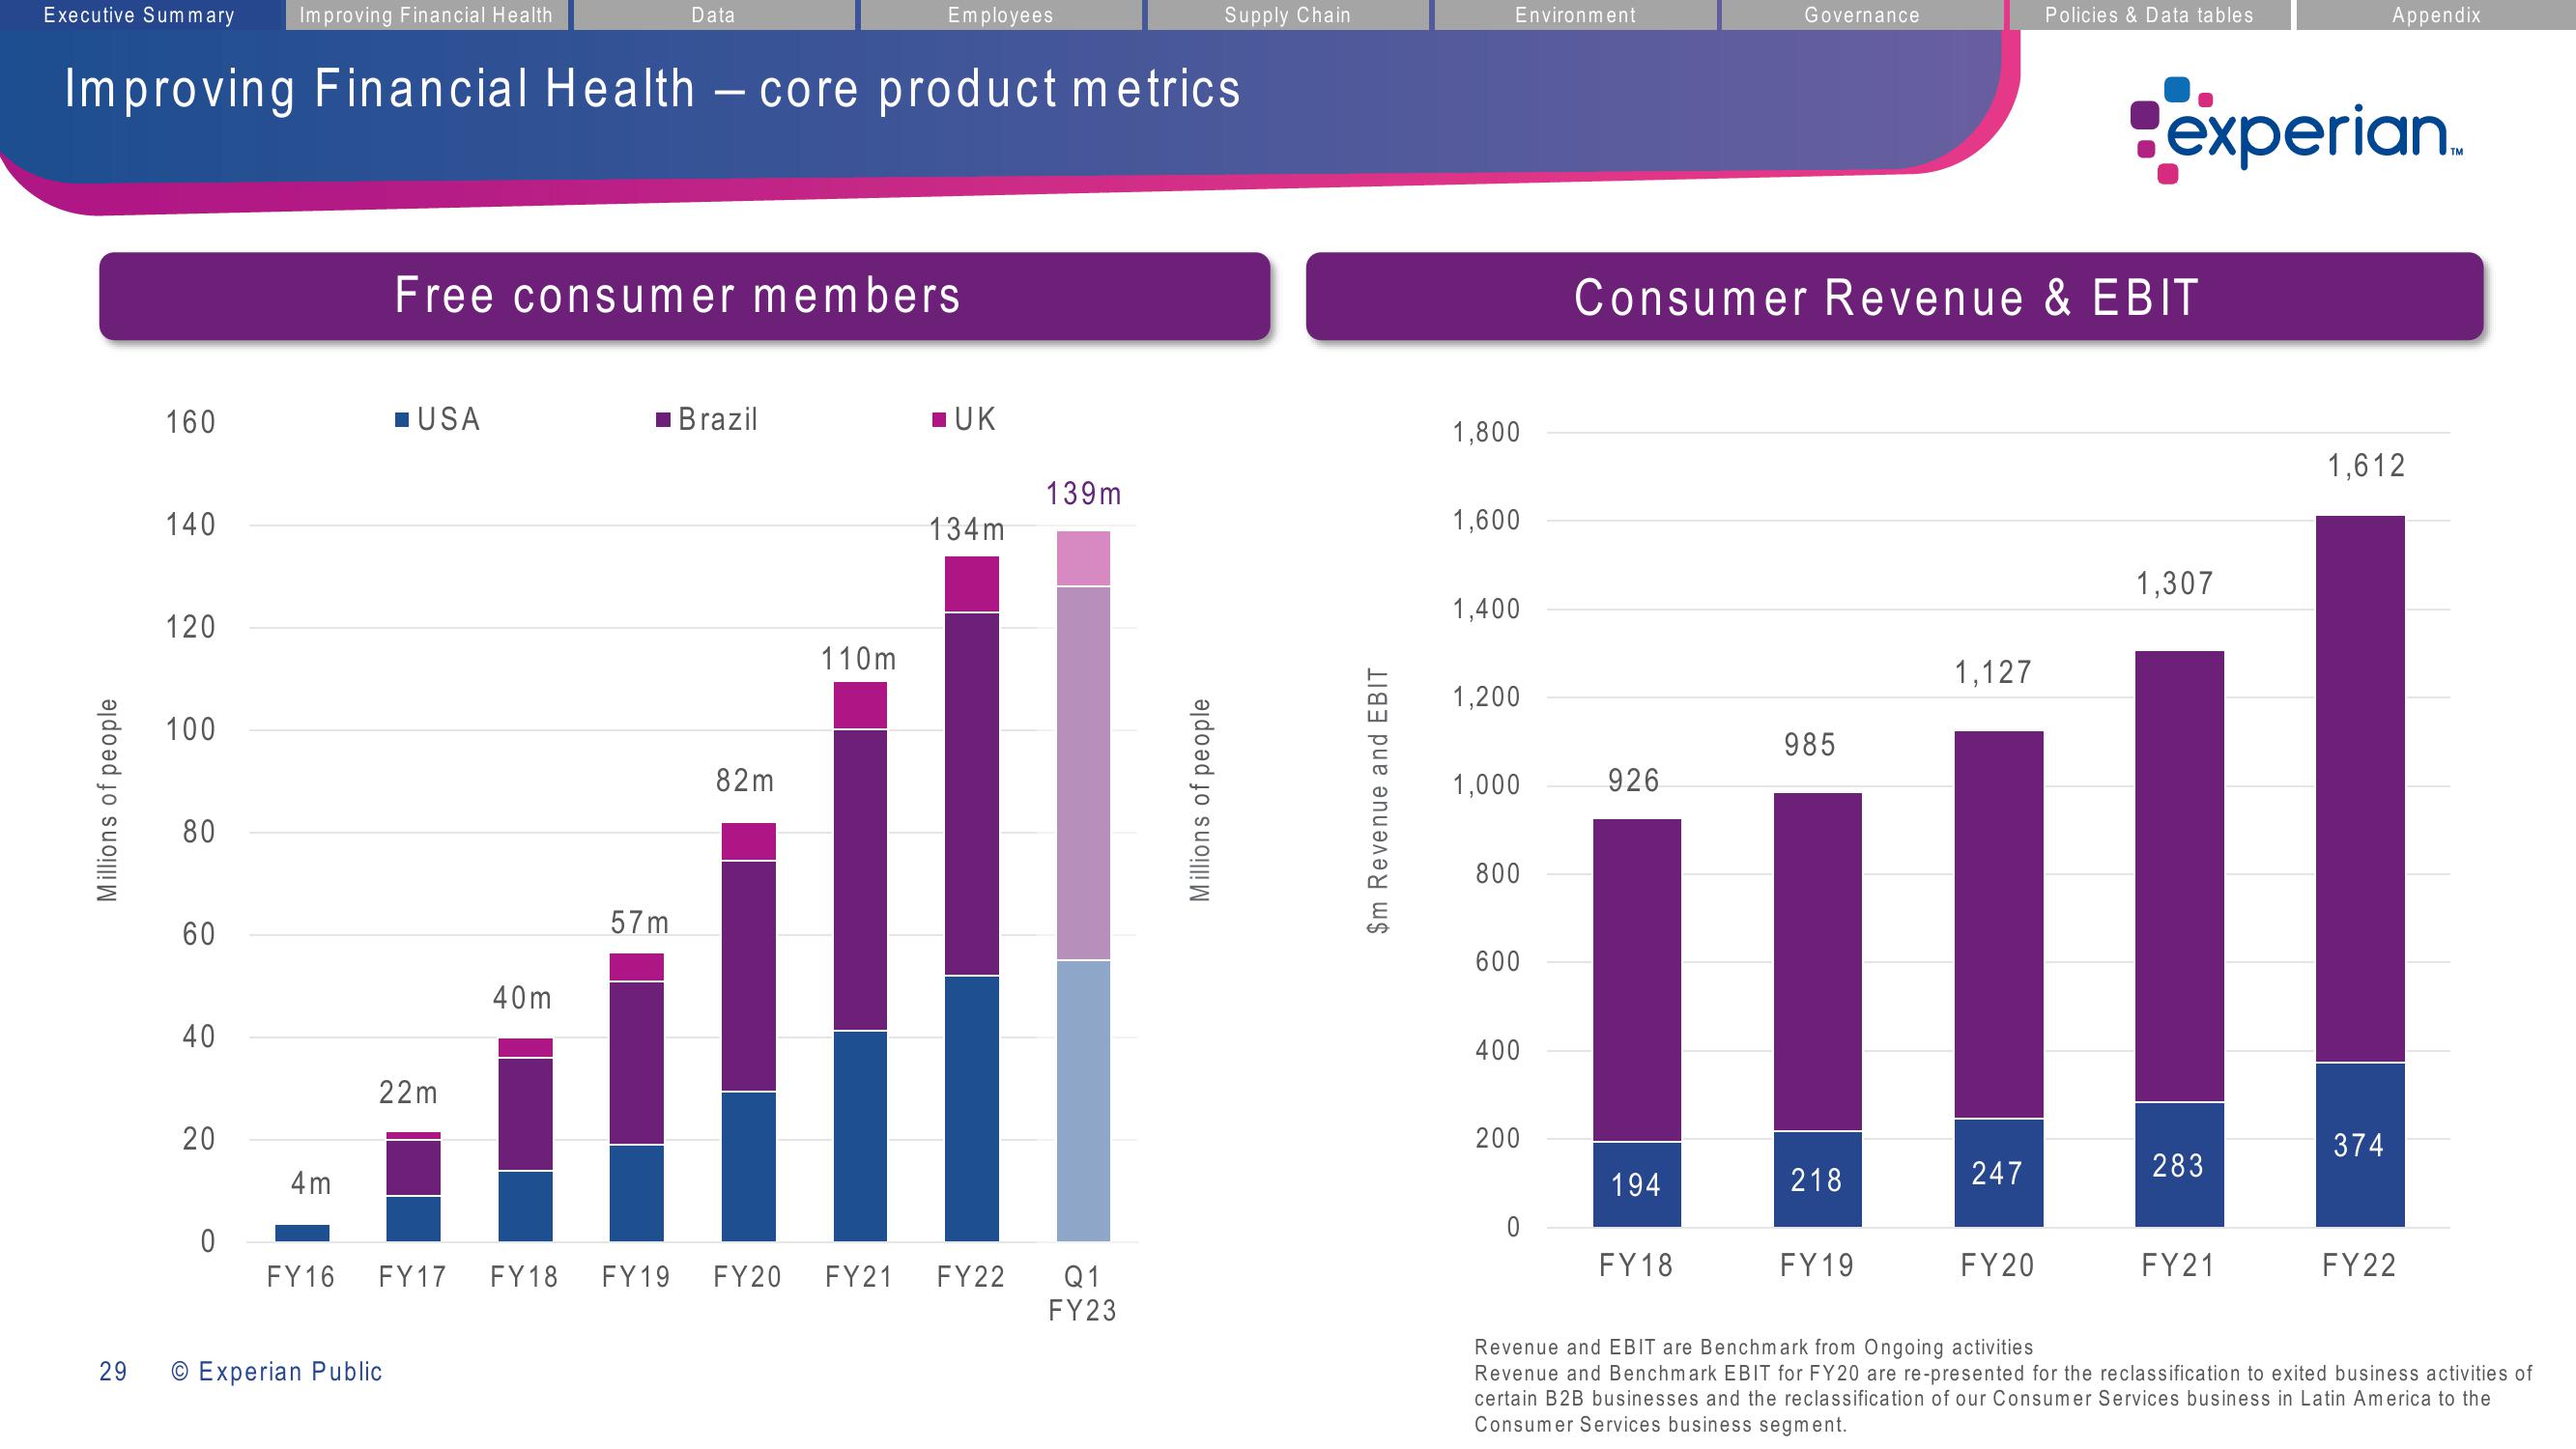
Improving Financial Health - core product metrics
Millions of people
29
160
140
120
100
80
60
40
20
Improving Financial Health
0
4m
FY16
■USA
22m
O Experian Public
Free consumer members
FY17
40m
FY18
Data
■Brazil
57m
82m
FY19 FY20
Employees
110m
FY21
■UK
134m
FY22
139m
Q1
FY23
Supply Chain
Millions of people
$m Revenue and EBIT
Environment
1,800
1,600
1,400
1,200
1,000
800
600
400
200
926
194
Governance
Consumer Revenue & EBIT
FY18
985
218
FY19
1,127
247
Policies & Data tables
FY20
experian
1,307
283
FY21
Appendix
1,612
374
FY22
TM
Revenue and EBIT are Benchmark from Ongoing activities
Revenue and Benchmark EBIT for FY20 are re-presented for the reclassification to exited business activities of
certain B2B businesses and the reclassification of our Consumer Services business in Latin America to the
Consumer Services business segment.View entire presentation