Avantor Results Presentation Deck
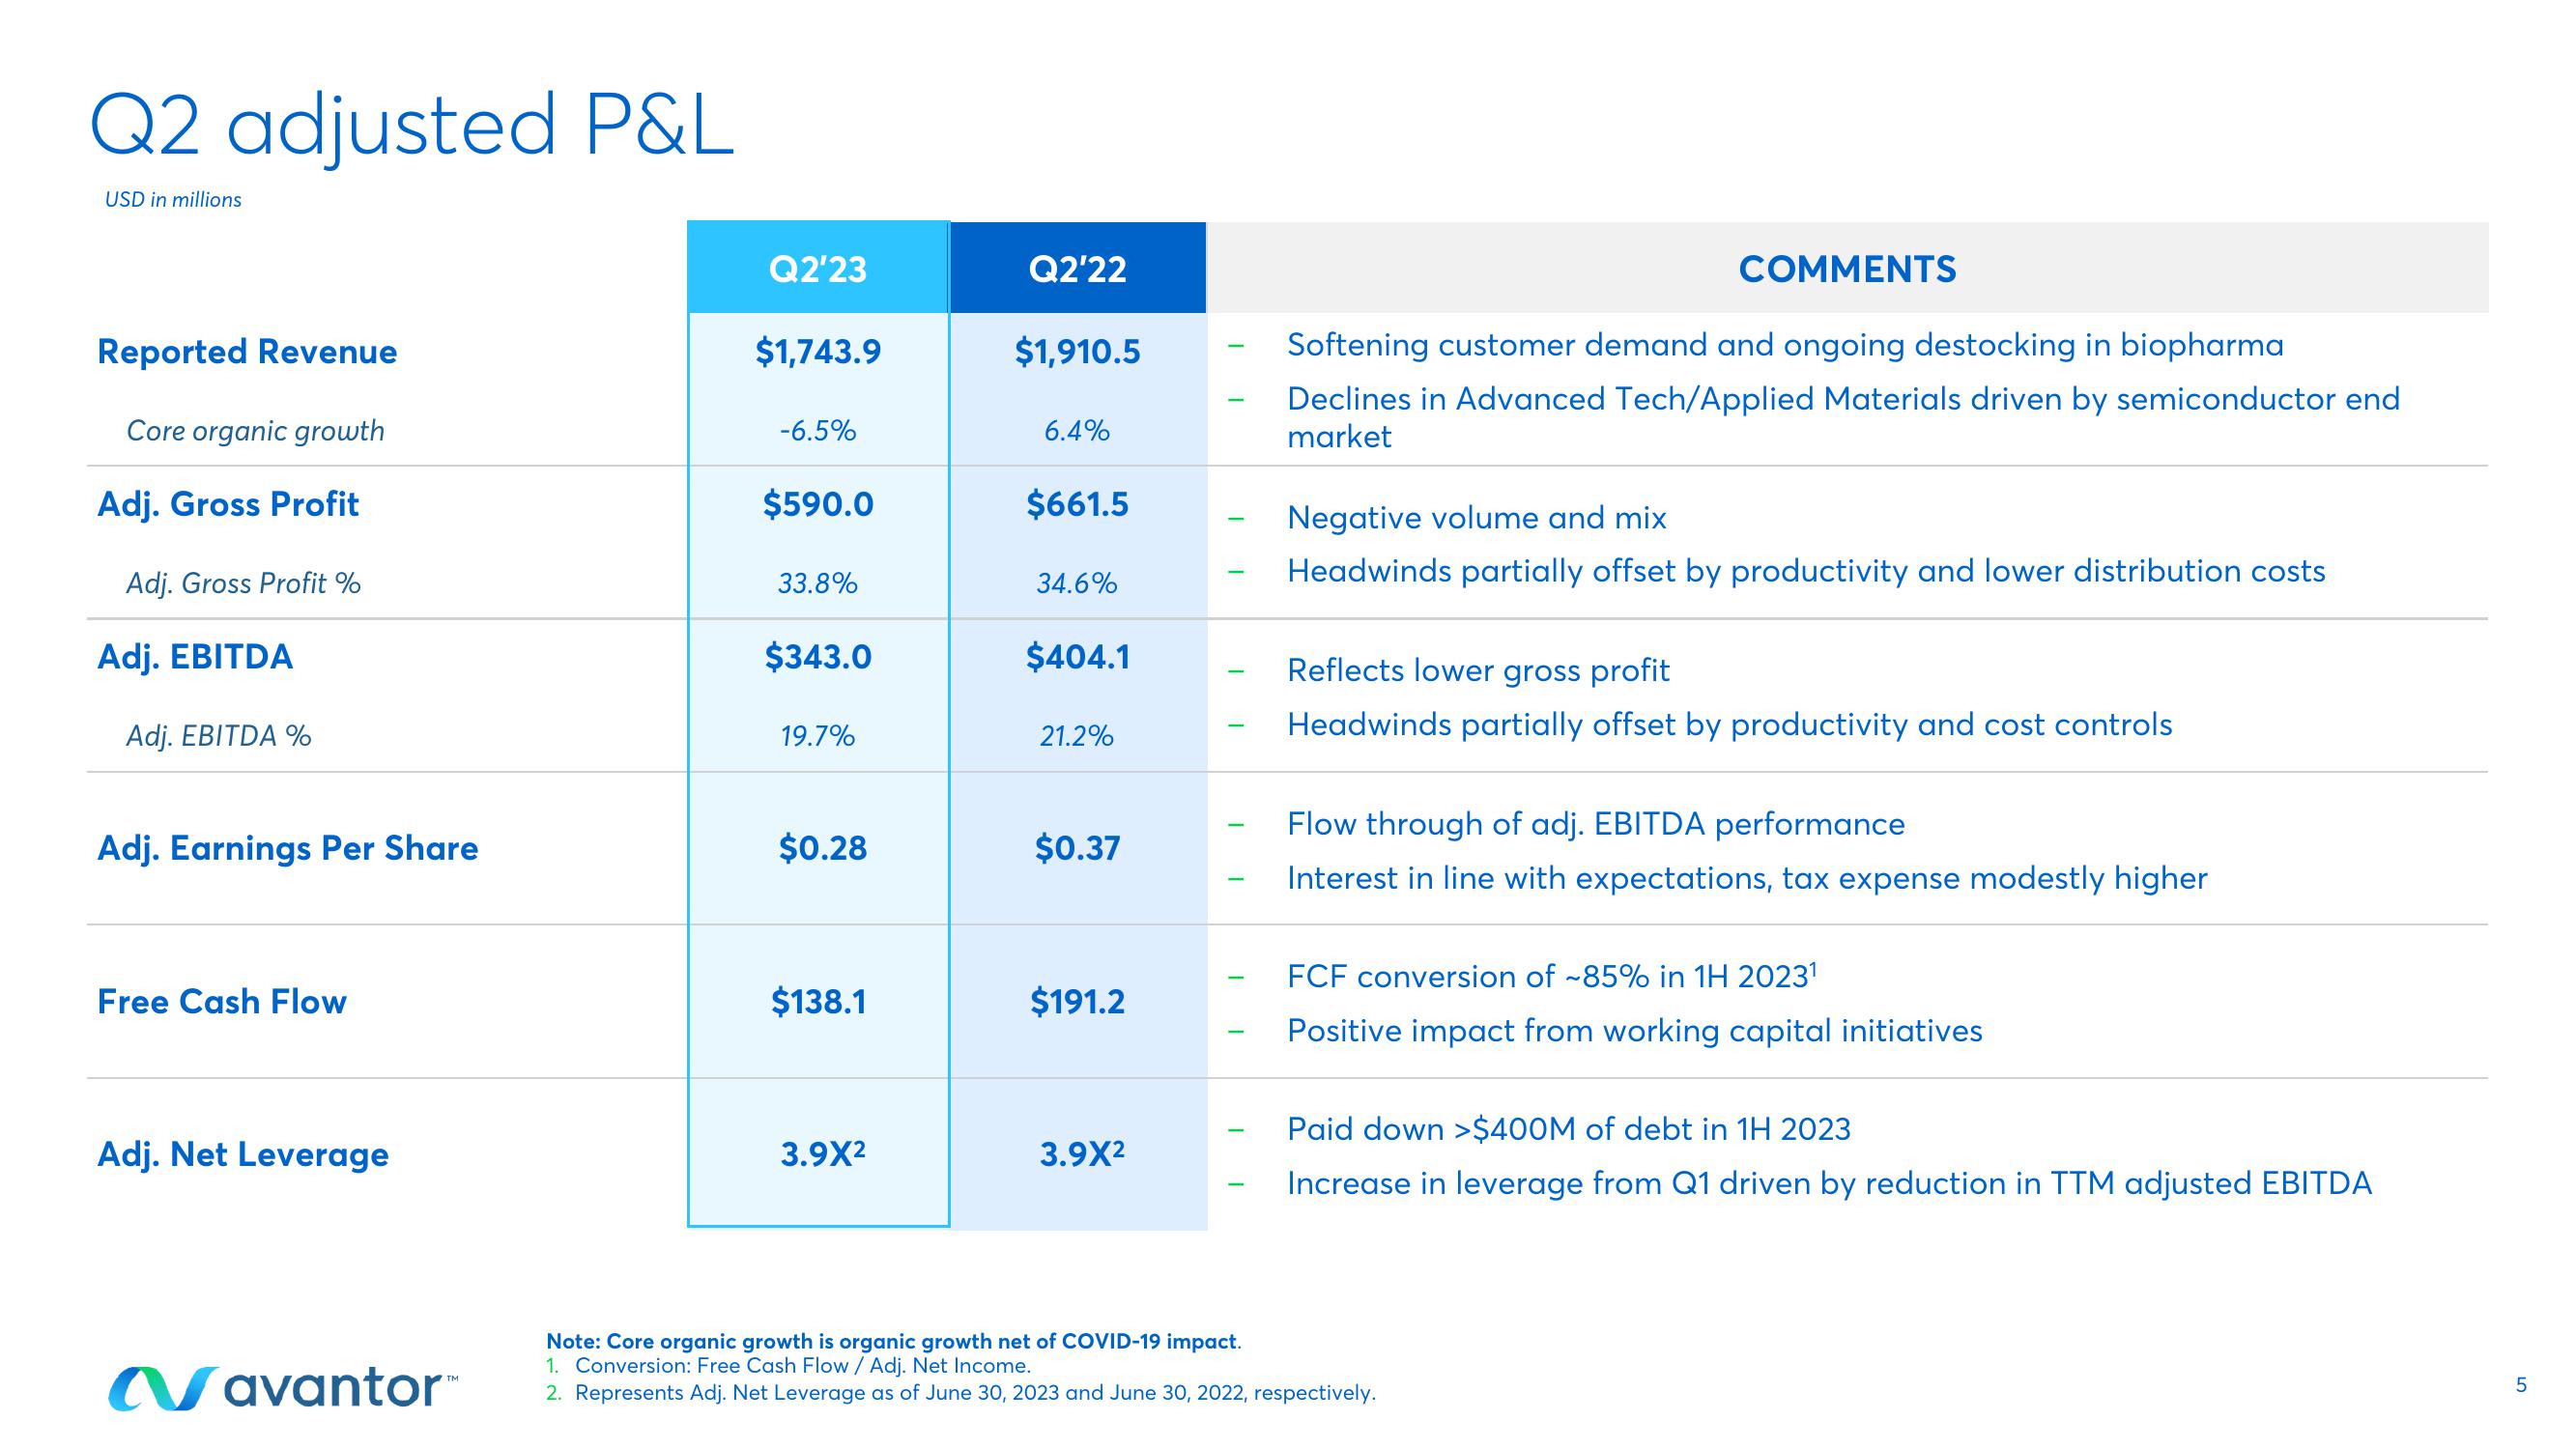
Q2 adjusted P&L
USD in millions
Reported Revenue
Core organic growth
Adj. Gross Profit
Adj. Gross Profit %
Adj. EBITDA
Adj. EBITDA %
Adj. Earnings Per Share
Free Cash Flow
Adj. Net Leverage
avantor™
Q2'23
$1,743.9
-6.5%
$590.0
33.8%
$343.0
19.7%
$0.28
$138.1
3.9X²
Q2'22
$1,910.5
6.4%
$661.5
34.6%
$404.1
21.2%
$0.37
$191.2
3.9X²
COMMENTS
Softening customer demand and ongoing destocking in biopharma
Declines in Advanced Tech/Applied Materials driven by semiconductor end
market
Negative volume and mix
Headwinds partially offset by productivity and lower distribution costs
Reflects lower gross profit
Headwinds partially offset by productivity and cost controls
Flow through of adj. EBITDA performance
Interest in line with expectations, tax expense modestly higher
FCF conversion of ~85% in 1H 2023¹
Positive impact from working capital initiatives
Paid down >$400M of debt in 1H 2023
Increase in leverage from Q1 driven by reduction in TTM adjusted EBITDA
Note: Core organic growth is organic growth net of COVID-19 impact.
1. Conversion: Free Cash Flow / Adj. Net Income.
2. Represents Adj. Net Leverage as of June 30, 2023 and June 30, 2022, respectively.
5
слView entire presentation