Spring 2023 Solar Industry Update
500
450
C
•
Top PV Markets
The leading 10 markets in terms of cumulative capacity remained
relatively unchanged between 2021 and 2022.
Brazil jumped ahead of Vietnam for the 10th spot in 2022.
462
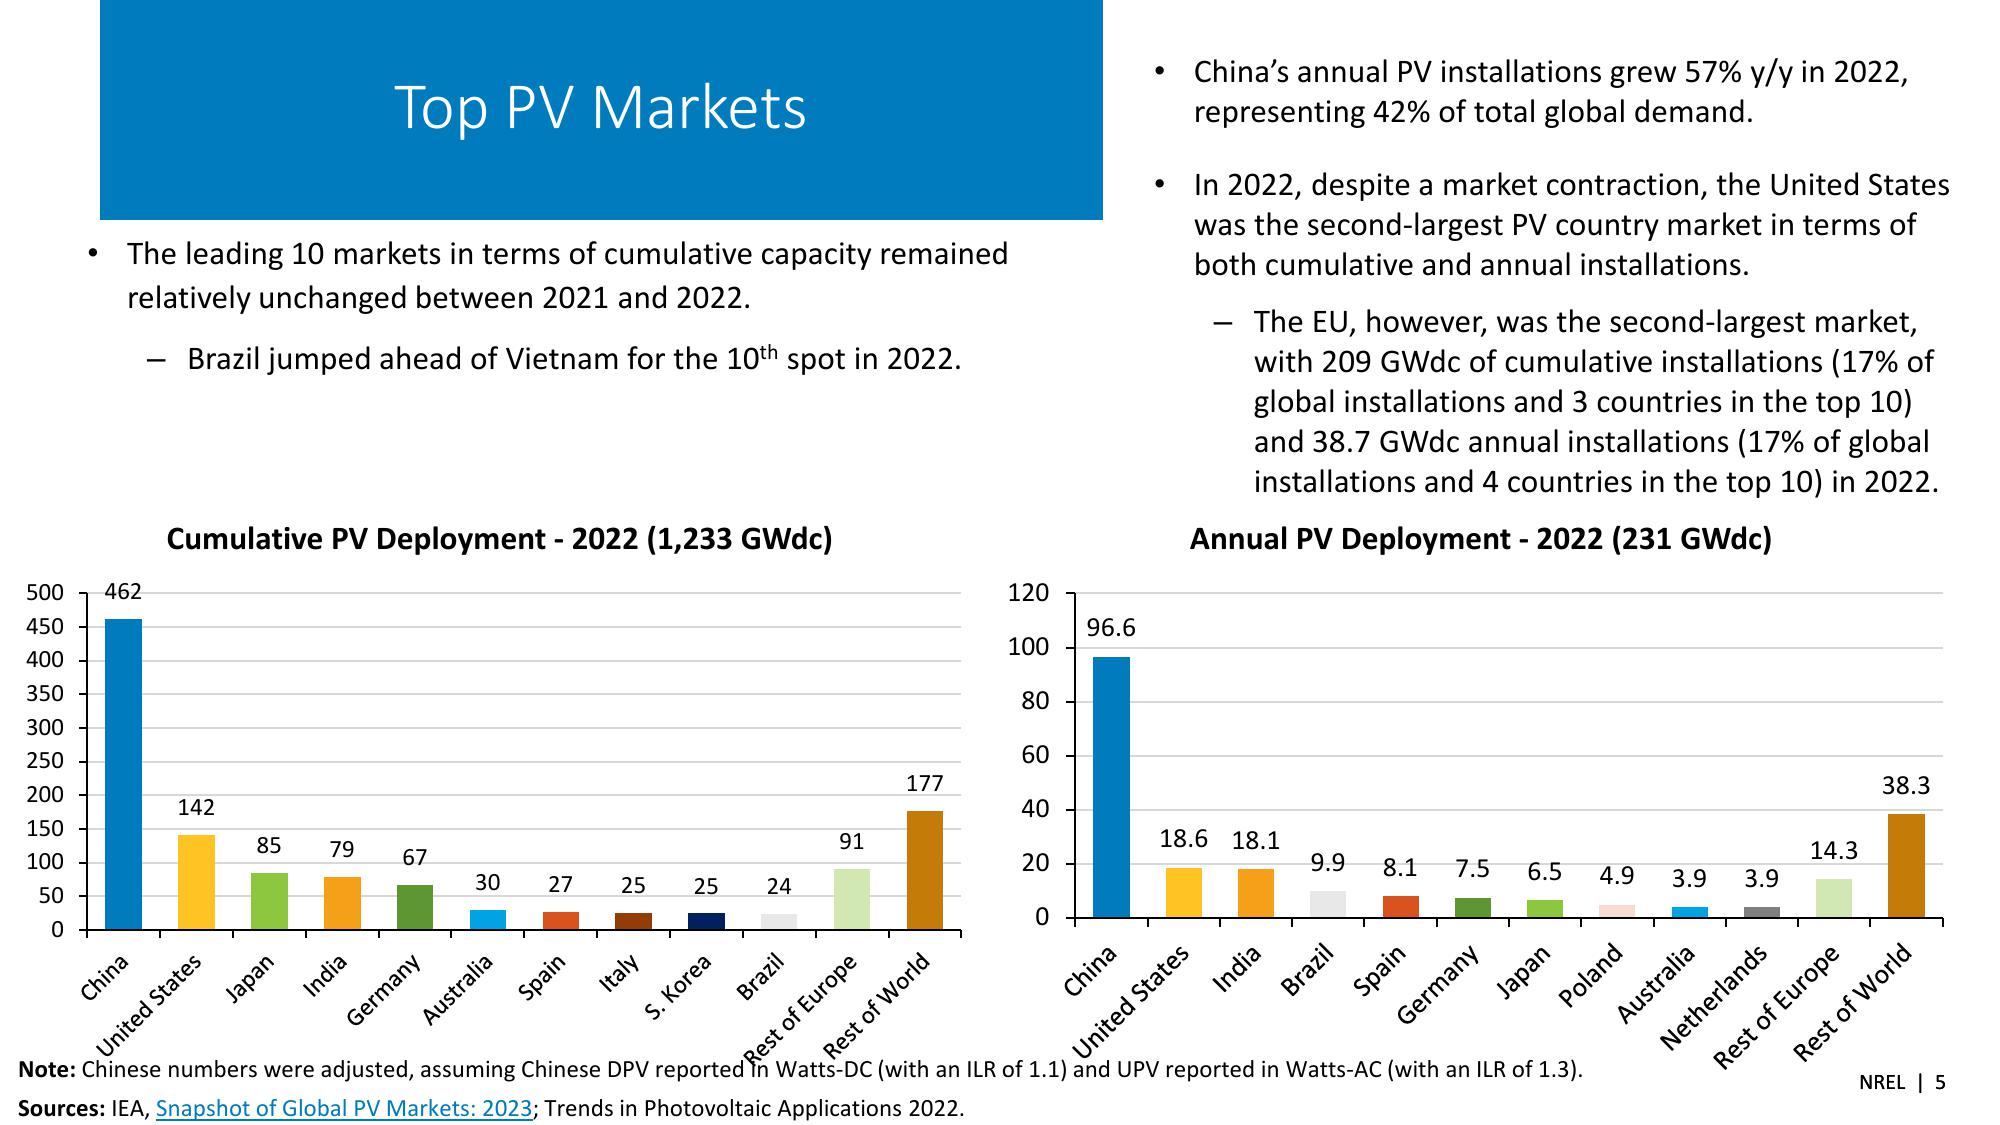
Cumulative PV Deployment - 2022 (1,233 GWdc)
120
•
•
China's annual PV installations grew 57% y/y in 2022,
representing 42% of total global demand.
In 2022, despite a market contraction, the United States
was the second-largest PV country market in terms of
both cumulative and annual installations.
The EU, however, was the second-largest market,
with 209 GWdc of cumulative installations (17% of
global installations and 3 countries in the top 10)
and 38.7 GWdc annual installations (17% of global
installations and 4 countries in the top 10) in 2022.
Annual PV Deployment - 2022 (231 GWdc)
400
350
300
250
200
142
150
100
50
38.3
14.3
4.9
3.9
3.9
Australia
Netherlands
Rest of Europe
Rest of World
0
China
United States
Japan
85
79
India
Germany
67
67
30
27
Australia
Spain
100
288
96.6
80
60
177
40
91
18.6 18.1
20
25
25
25
24
Note: Chinese numbers were adjusted, assuming Chinese DPV reported
Italy
S. Korea
Brazil
Sources: IEA, Snapshot of Global PV Markets: 2023; Trends in Photovoltaic Applications 2022.
Rest of Europe
at Rest of World
0
China
United States
India
Brazil
Spain
9.9 8.1 7.5 6.5
Germany
Japan
Poland
Watts-DC (with an ILR of 1.1) and UPV reported in Watts-AC (with an ILR of 1.3).
NREL | 5View entire presentation