Barclays Global Financial Services Conference
Wholesale Banking restructure update
Business restructure
Pro-active response to market developments / headwinds
Reduce asset and capital usage to improve balance sheet
strength, funding profile and ROE
Focus on strongest businesses and exit loss-makers
Seek cost synergies
Enhance connectivity with other divisions
Executing well across all elements
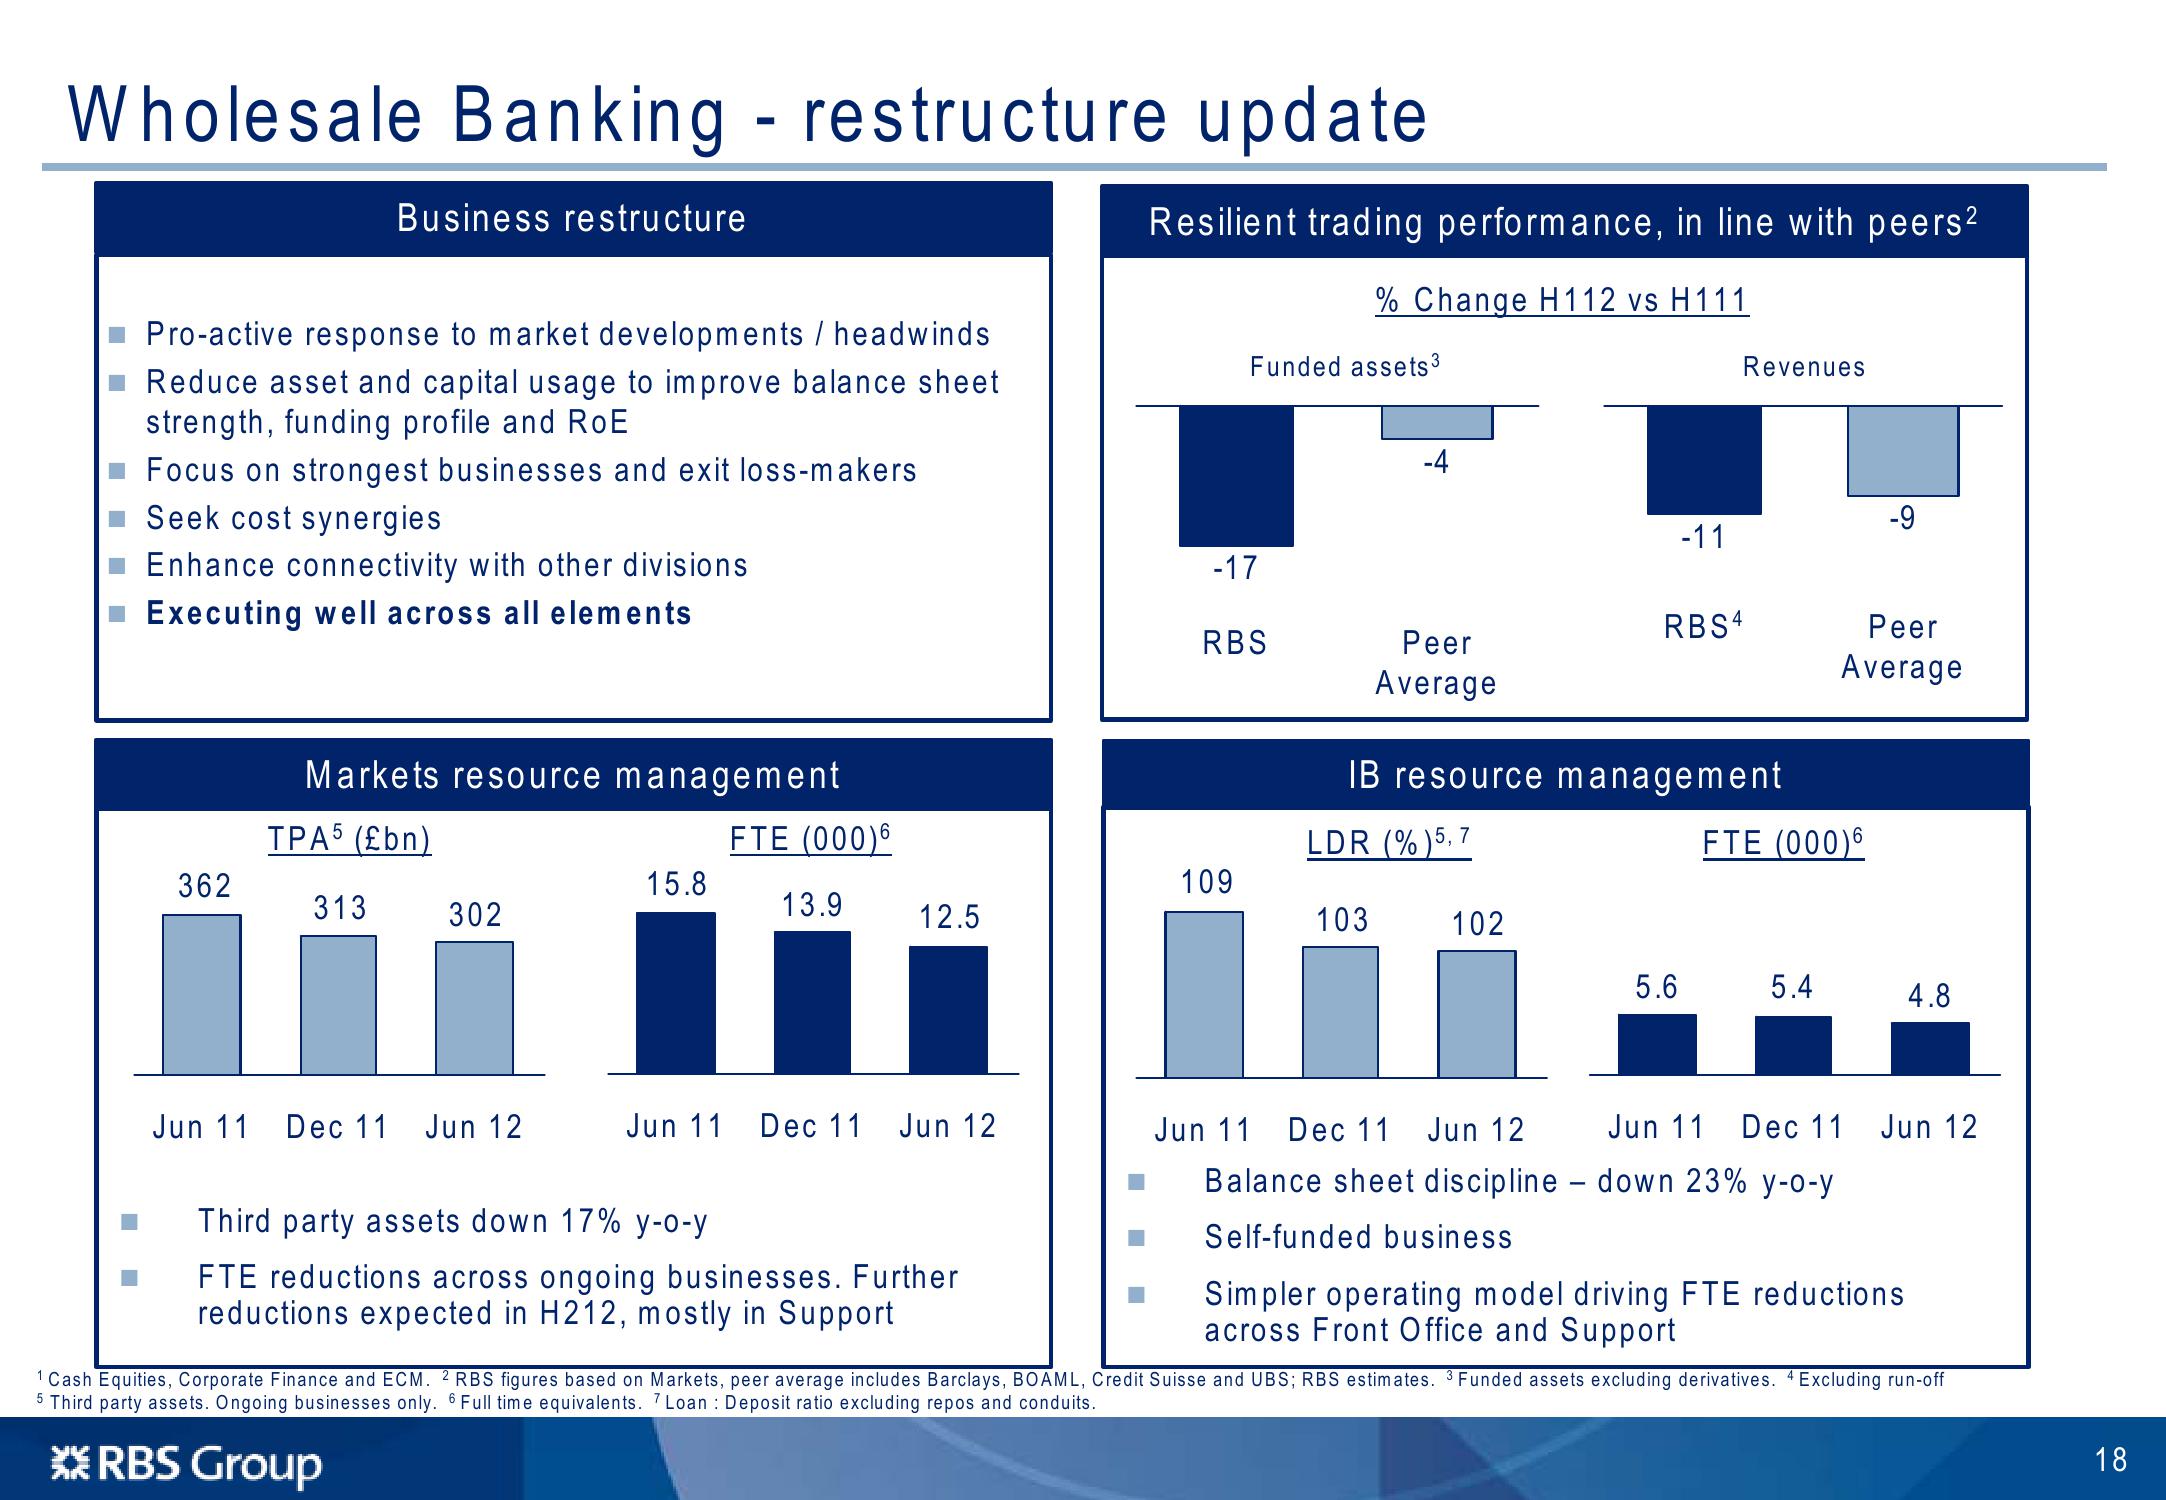
Resilient trading performance, in line with peers²
% Change H112 vs H111
Funded assets³
Revenues
-4
-11
-17
RBS4
RBS
Peer
Average
Peer
Average
Markets resource management
IB resource management
TPA5 (£bn)
FTE (000)6
LDR (%) 5, 7
FTE (000)6
362
15.8
109
313
13.9
302
12.5
103
102
5.6
5.4
4.8
Jun 11
Dec 11 Jun 12
Jun 11 Dec 11 Jun 12
Jun 11 Dec 11 Jun 12
Jun 11 Dec 11 Jun 12
Third party assets down 17% y-o-y
FTE reductions across ongoing businesses. Further
reductions expected in H212, mostly in Support
Balance sheet discipline - down 23% y-o-y
Self-funded business
Simpler operating model driving FTE reductions
across Front Office and Support
1 Cash Equities, Corporate Finance and ECM. 2 RBS figures based on Markets, peer average includes Barclays, BOAML, Credit Suisse and UBS; RBS estimates. 3 Funded assets excluding derivatives. 4 Excluding run-off
5 Third party assets. Ongoing businesses only. 6 Full time equivalents. 7 Loan Deposit ratio excluding repos and conduits.
RBS Group
18View entire presentation