Melrose Results Presentation Deck
Melrose Group cash generation: leverage¹ reducing
Melrose
Free cash flow 1
Cash flow
£m
Adjusted¹ operating profit
Depreciation and amortisation
Lease obligation payments
Non-cash impact from loss-making contracts
Movement in working capital:
Inventory
Receivables & payables
Adjusted operating cash flow (pre-capex)¹
Net capital expenditure
Defined benefit pension contributions - ongoing
Trading net other
Restructuring
Free cash flow pre-interest and tax¹
Net interest and net tax paid
Free cash flow ¹
Adjusted free cash flow ¹
H1 2023
159
■
71
(16)
(13)
(53)
(116)
32
(40)
(2)
(53)
(69)
(49)
(118)
(65)
Reconciliation of net debt¹
£m
Net debt¹ as at 1 January 2023
Net cash outflow from Dowlais businesses to date of demerger²
Reduction in net debt following the demerger of Dowlais
Demerger related costs and pension buy-in³
Dividends paid to shareholders
Proforma net debt¹ as at 1 January 2023
Free cash flow in the period
Foreign exchange and other non-cash movements ³
Net debt¹ at 30 June 2023
H1 2023
(1,139)
(54)
1.
Described in the glossary to the 2023 Interim Financial Statements and considered by the Board to be a key measure of performance
Includes £17 million of finance costs on demerger settled net debt
2.
3. Includes £16 million of demerger related costs unpaid at 30 June 2023, reversed through non-cash movements
885
(118)
(61)
(487)
(118)
52
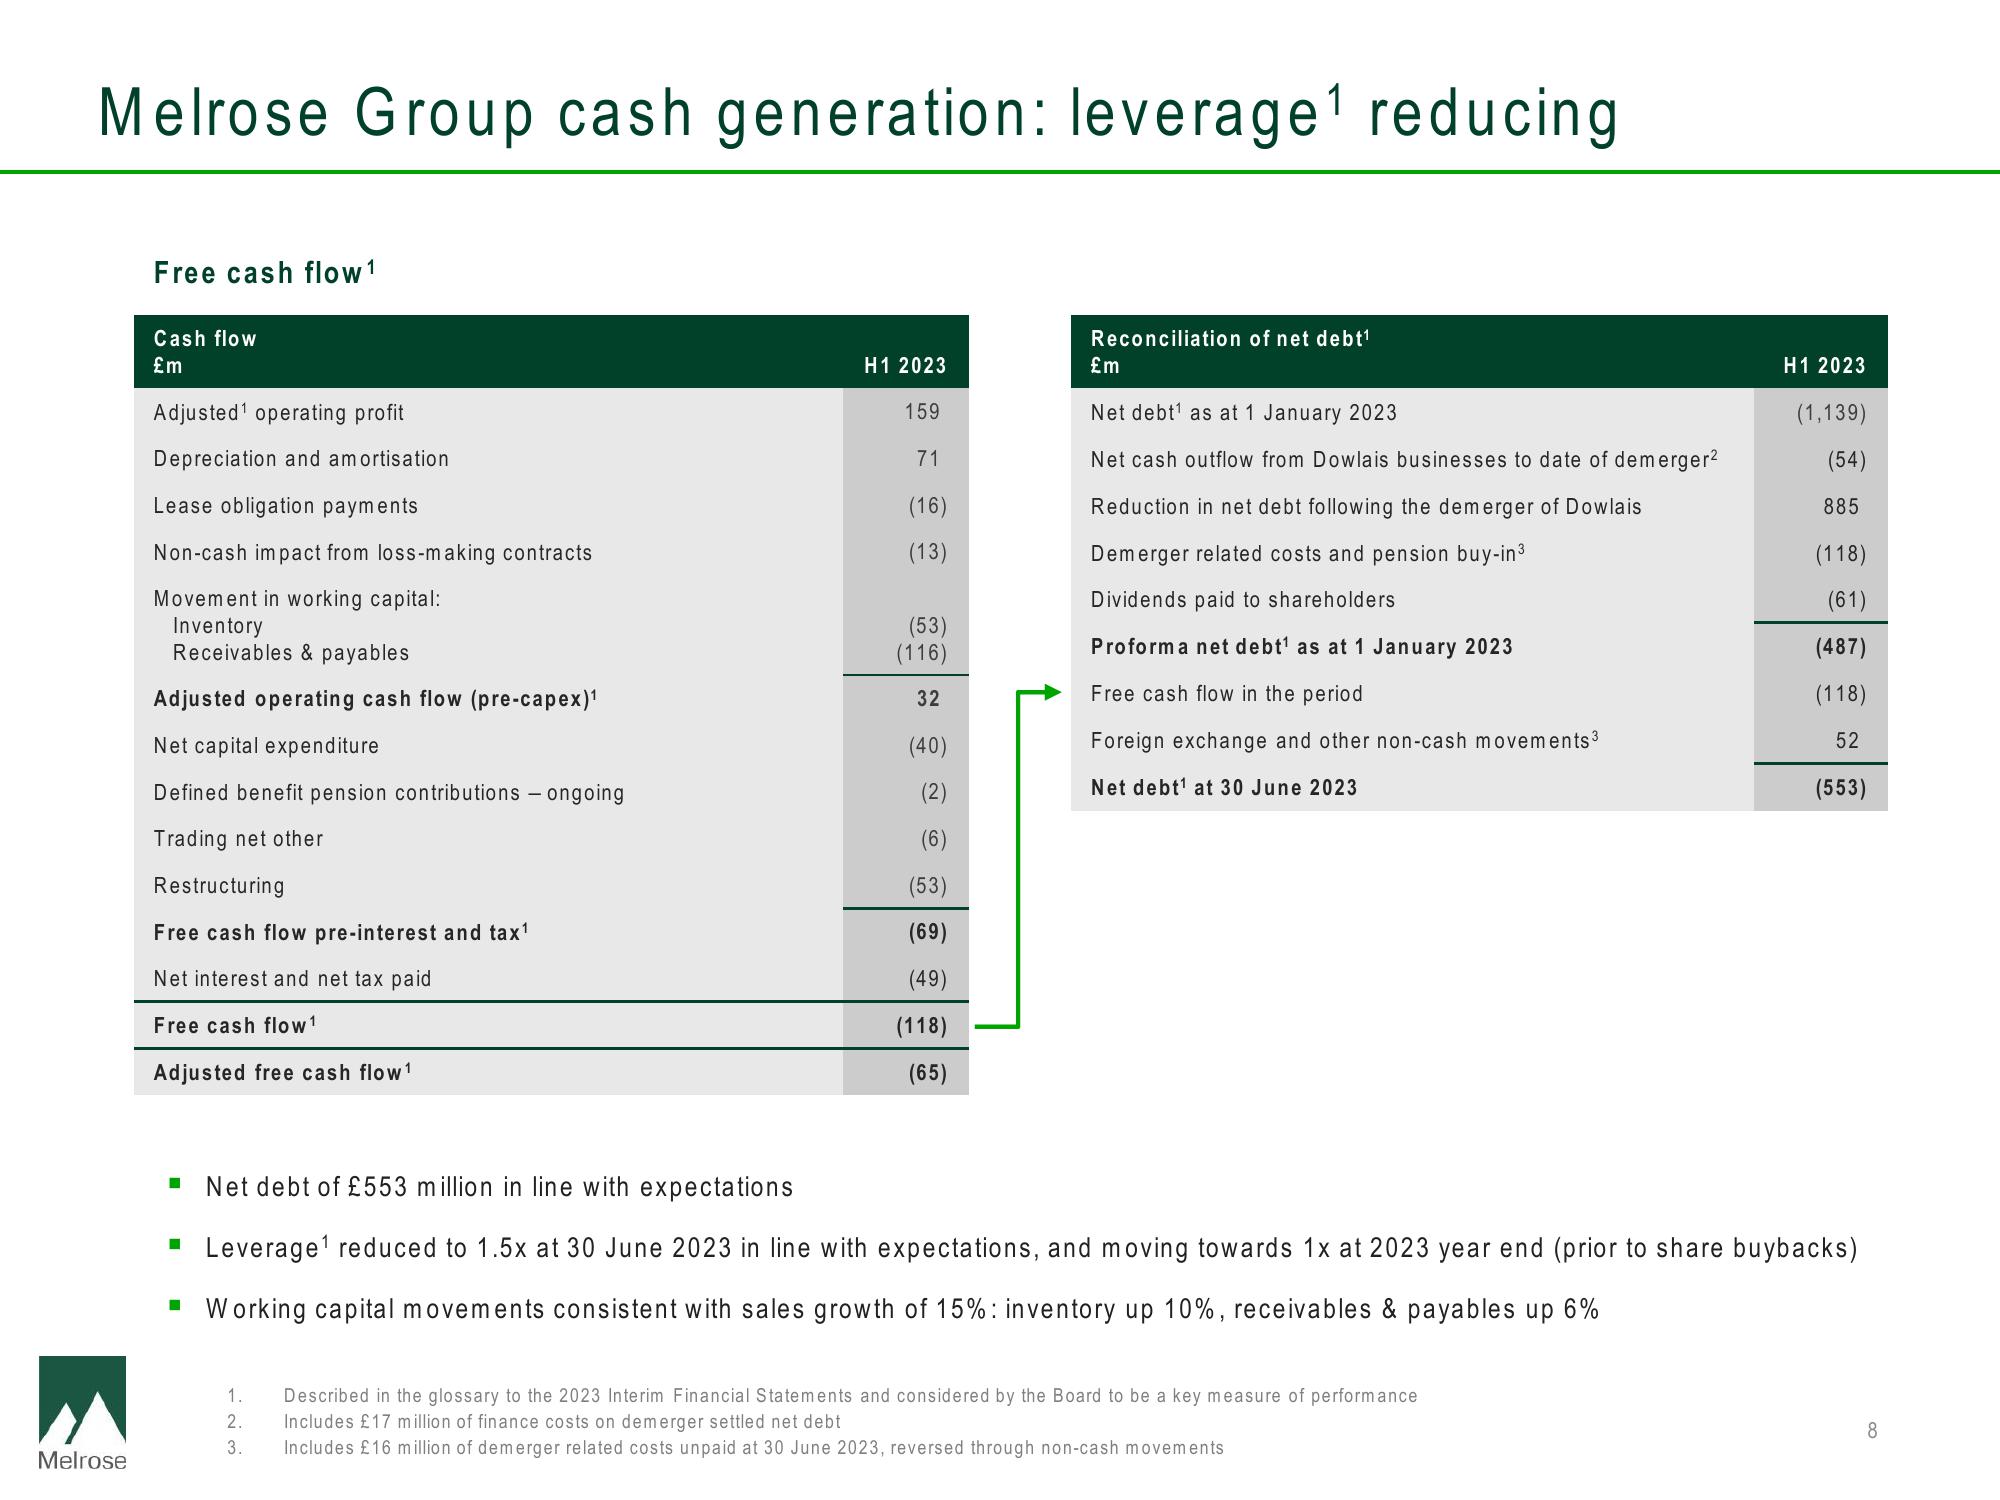
■ Net debt of £553 million in line with expectations
▪ Leverage¹ reduced to 1.5x at 30 June 2023 in line with expectations, and moving towards 1x at 2023 year end (prior to share buybacks)
Working capital movements consistent with sales growth of 15%: inventory up 10%, receivables & payables up 6%
(553)
8View entire presentation