AstraZeneca Results Presentation Deck
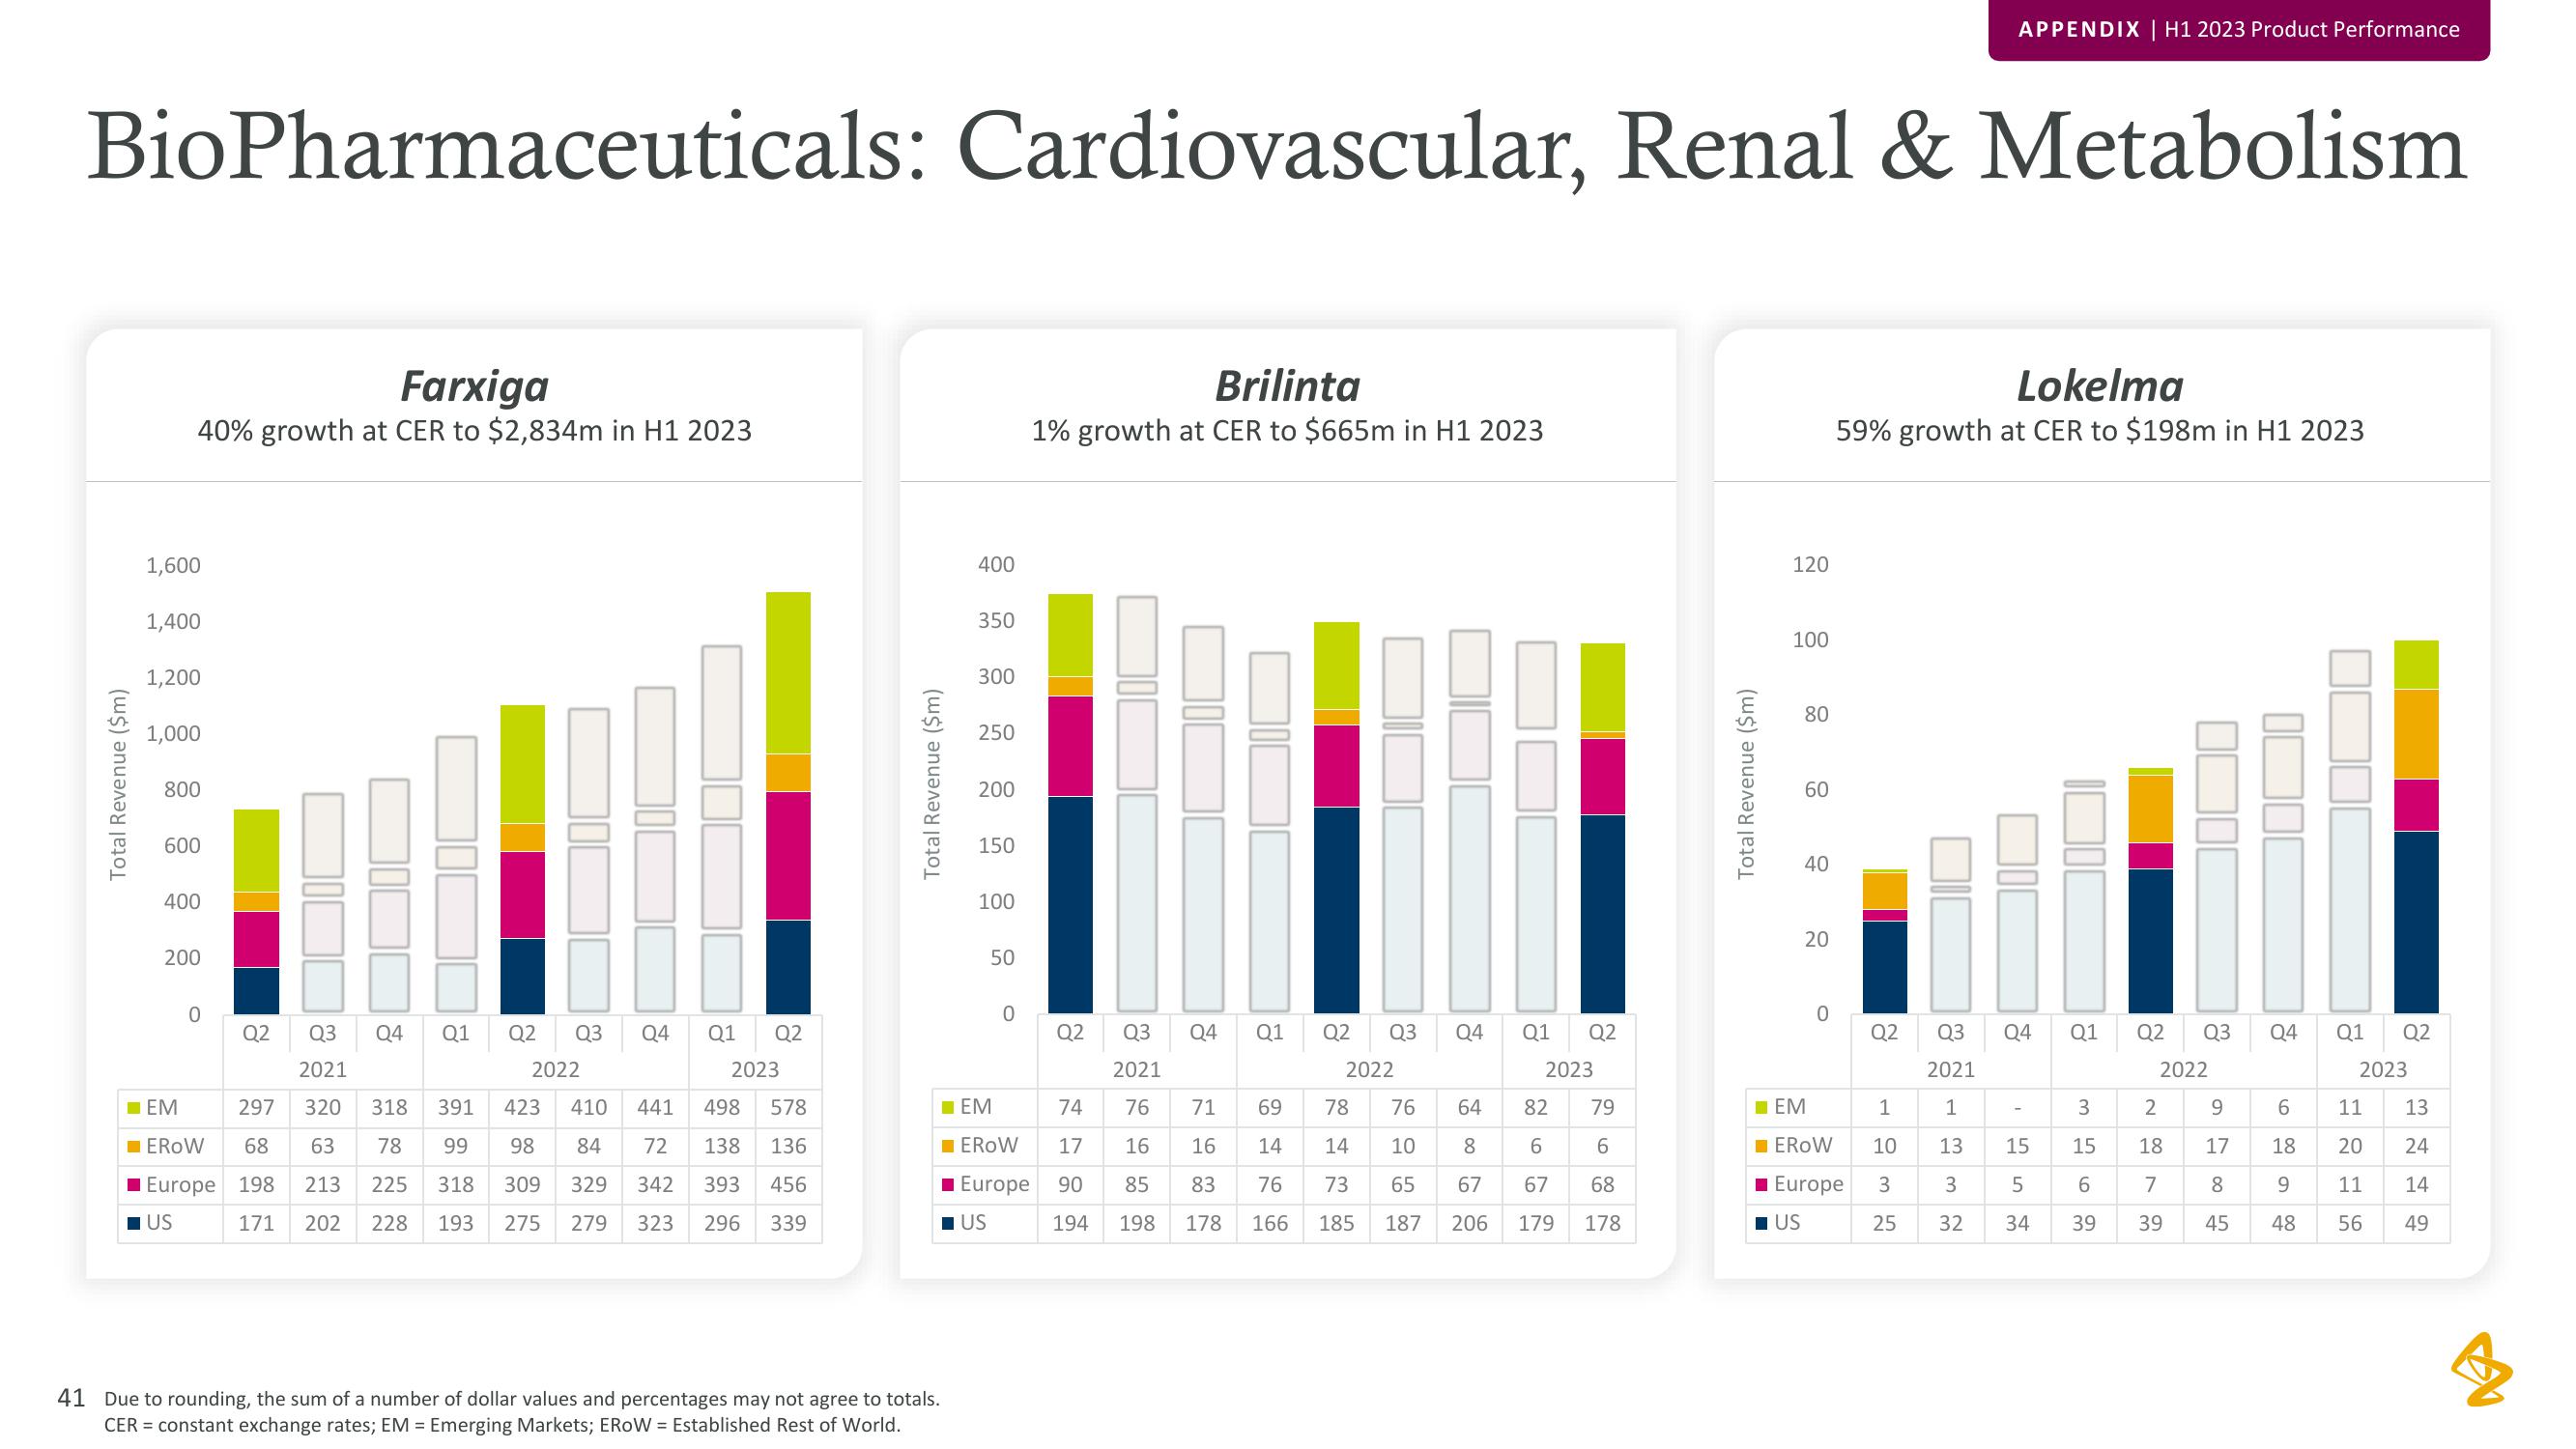
BioPharmaceuticals: Cardiovascular, Renal & Metabolism
Total Revenue ($m)
Farxiga
40% growth at CER to $2,834m in H1 2023
1,600
1,400
1,200
1,000
800
600
400
200
ΠΕΜ
0
Q3
2021
297
320 318 391
423
68 63 78
99 98
213 225 318 309 329
171 202 228 193 275 279
Q2
Q4 Q1
EROW
Europe 198
US
Q2
Q3 Q4
2022
410
441
84 72
Q1
Q2
2023
498 578
138 136
342 393 456
323 296 339
Total Revenue ($m)
400
41 Due to rounding, the sum of a number of dollar values and percentages may not agree to totals.
CER = constant exchange rates; EM = Emerging Markets; EROW = Established Rest of World.
350
300
250
200
150
100
50
0
☐EM
■EROW
■ Europe
■US
Brilinta
1% growth at CER to $665m in H1 2023
Q2
74
17
90
194
Q3
2021
76 71 69
16
16
14
85 83
76
198 178
166
Q4 Q1
Q2 Q3
2022
78
76
14
10
73
65
185 187
Q4
Q1
Q2
2023
64
82
8
6
67 67
206 179
79
6
68
178
Total Revenue ($m)
120
100
80
60
40
20
☐EM
0
Lokelma
59% growth at CER to $198m in H1 2023
EROW
■ Europe
■US
APPENDIX | H1 2023 Product Performance
Q2
1
10
3
25
Q3 Q4
2021
1
13
3
32
15
5
34
Q1
3
15
6
39
Q2 Q3 Q4 Q1
2022
2
18
7
39
9
17
8
45
6
18
9
48
Q2
2023
11 13
20
24
11
14
56
49View entire presentation