Syniverse SPAC Presentation Deck
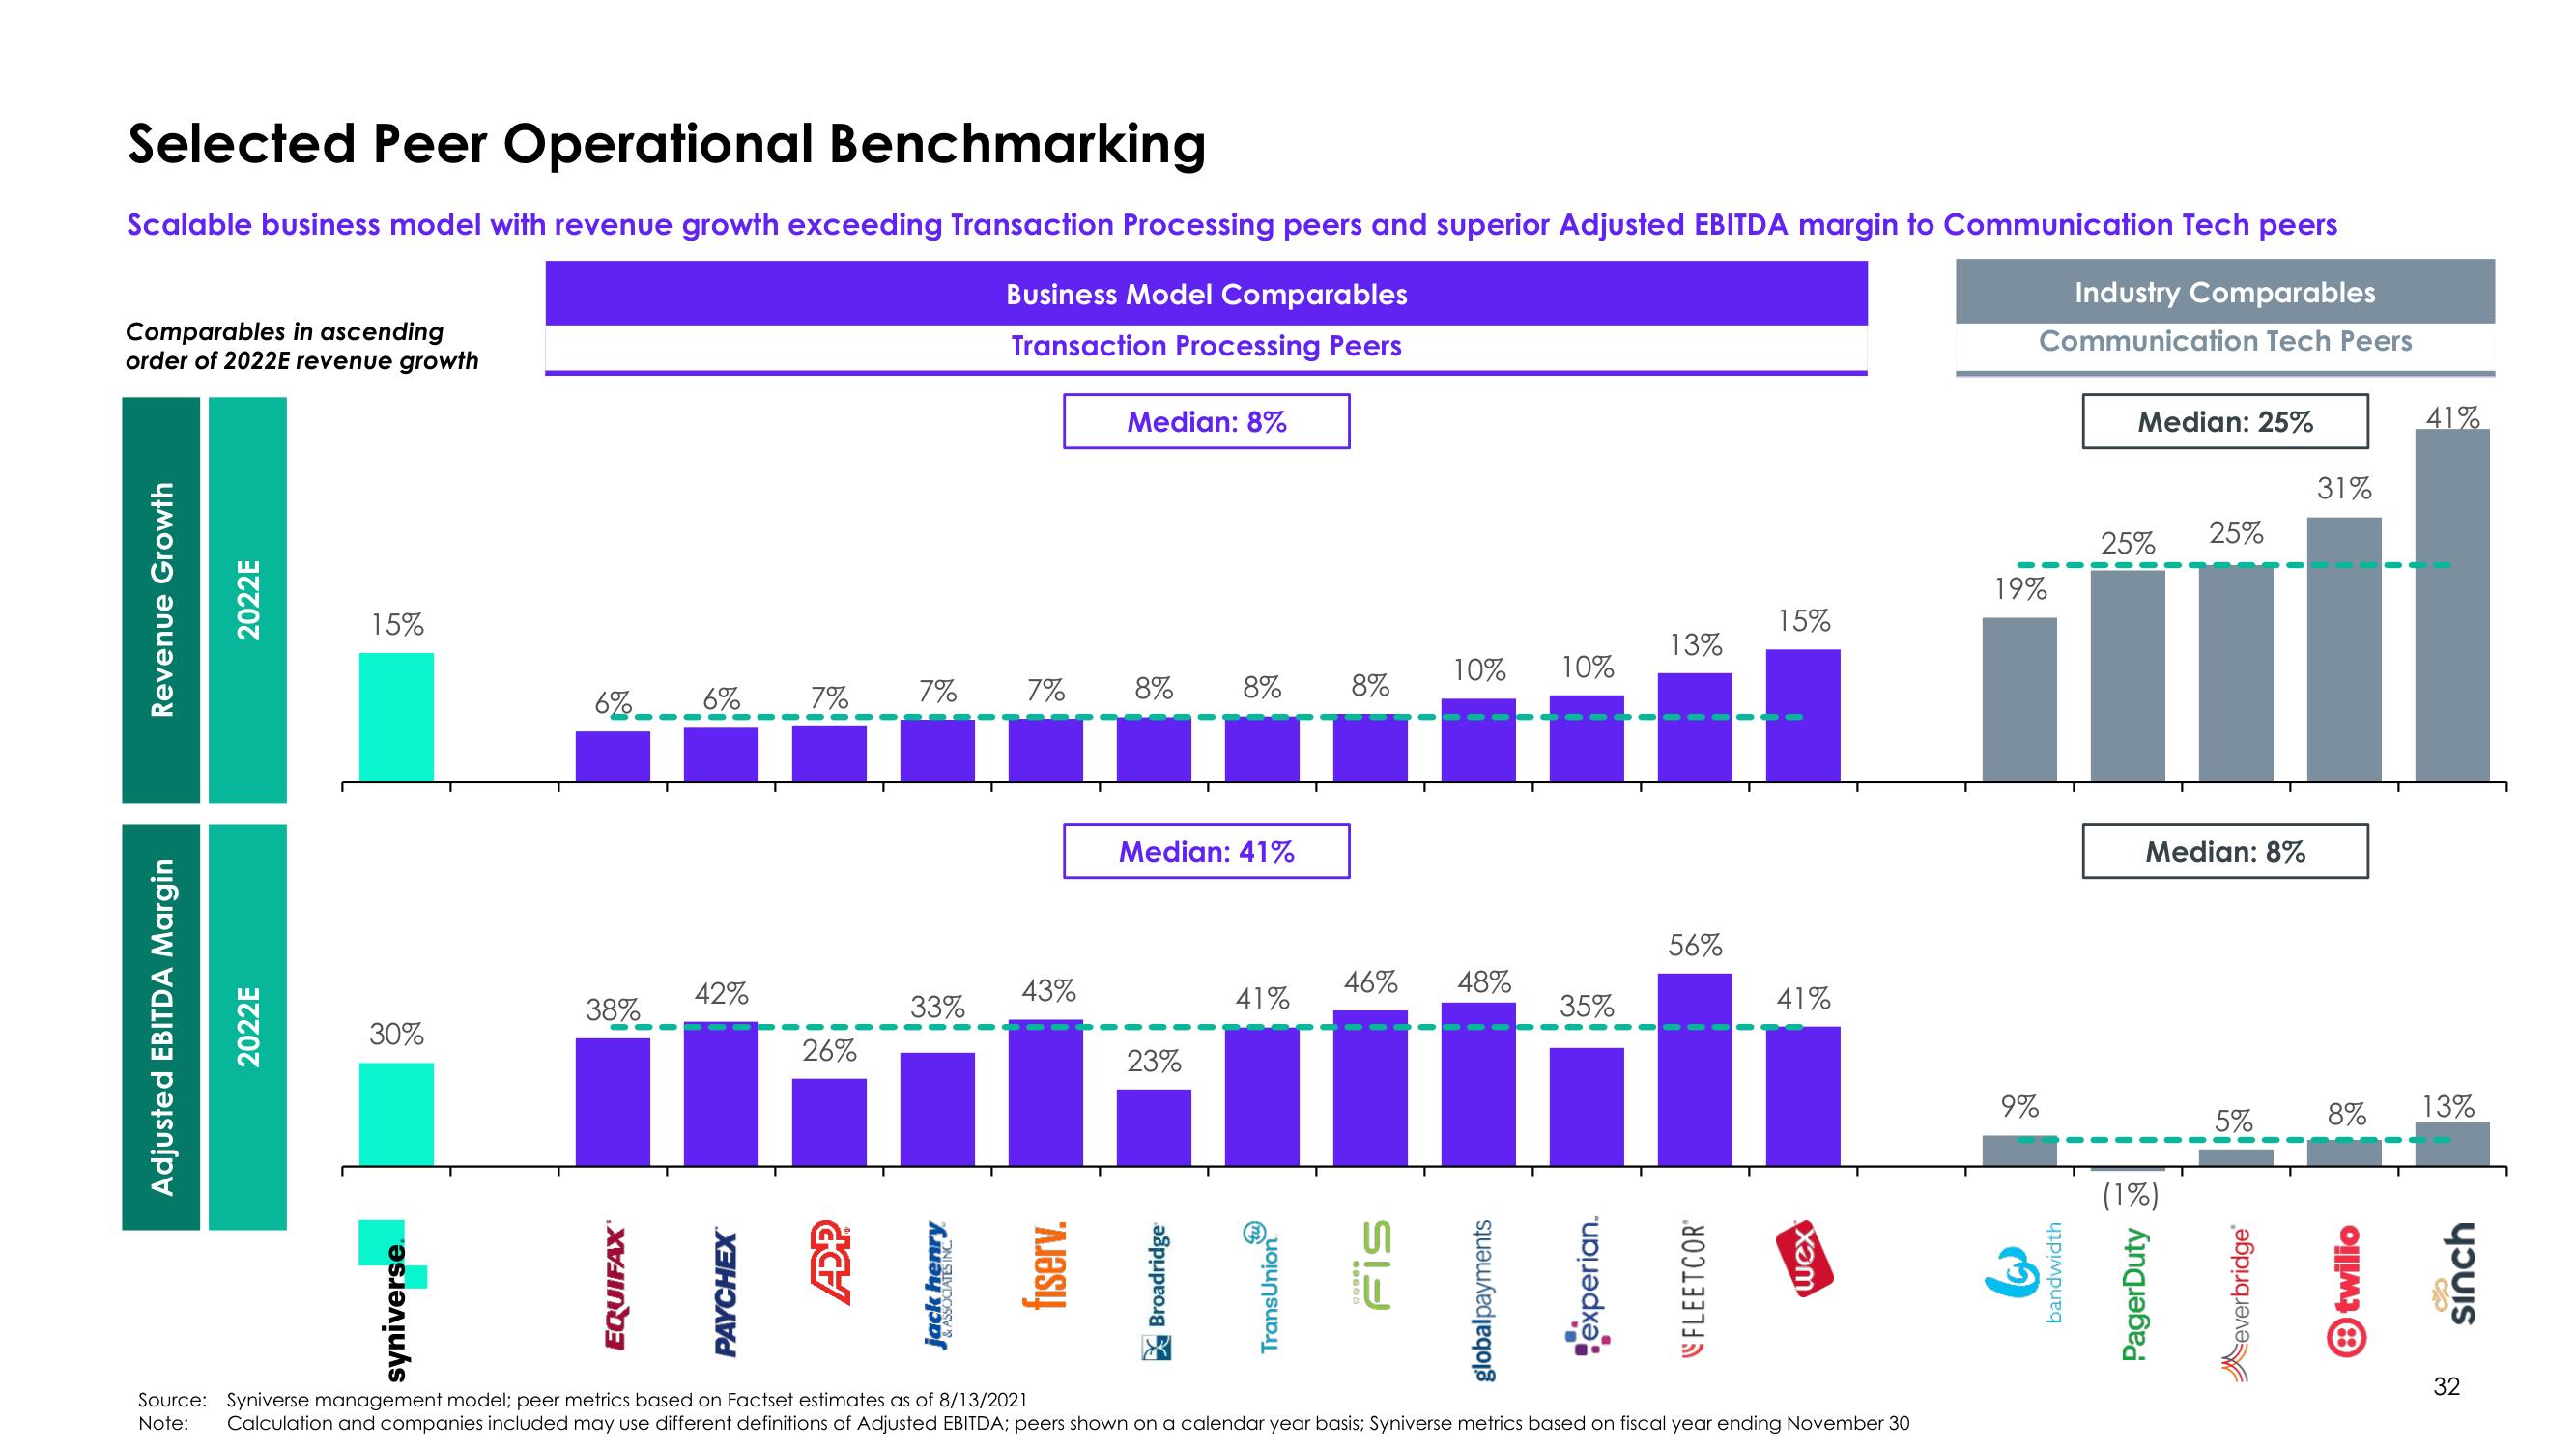
Selected Peer Operational Benchmarking
Scalable business model with revenue growth exceeding Transaction Processing peers and superior Adjusted EBITDA margin to Communication Tech peers
Business Model Comparables
Transaction Processing Peers
Industry Comparables
Communication Tech Peers
Comparables in ascending
order of 2022E revenue growth
Revenue Growth
Adjusted EBITDA Margin
2022E
2022E
15%
30%
syniverse
6%
38%
6%
42%
7%
26%
7%
33%
7%
43%
fiserv.
Median: 8%
8%
8%
Median: 41%
23%
41%
8%
10% 10%
46% 48%
35%
13%
56%
FLEETCOR
15%
41%
xam
Source: Syniverse management model; peer metrics based on Factset estimates as of 8/13/2021
Note: Calculation and companies included may use different definitions of Adjusted EBITDA; peers shown on a calendar year basis; Syniverse metrics based on fiscal year ending November 30
19%
9%
bandwidth
Median: 25%
25% 25%
Median: 8%
(1%)
PagerDuty
5%
everbridge®
31%
8%
twilio
41%
13%
sinch
3
32View entire presentation