Porch SPAC Presentation Deck
(1)
(3)
(5)
(6)
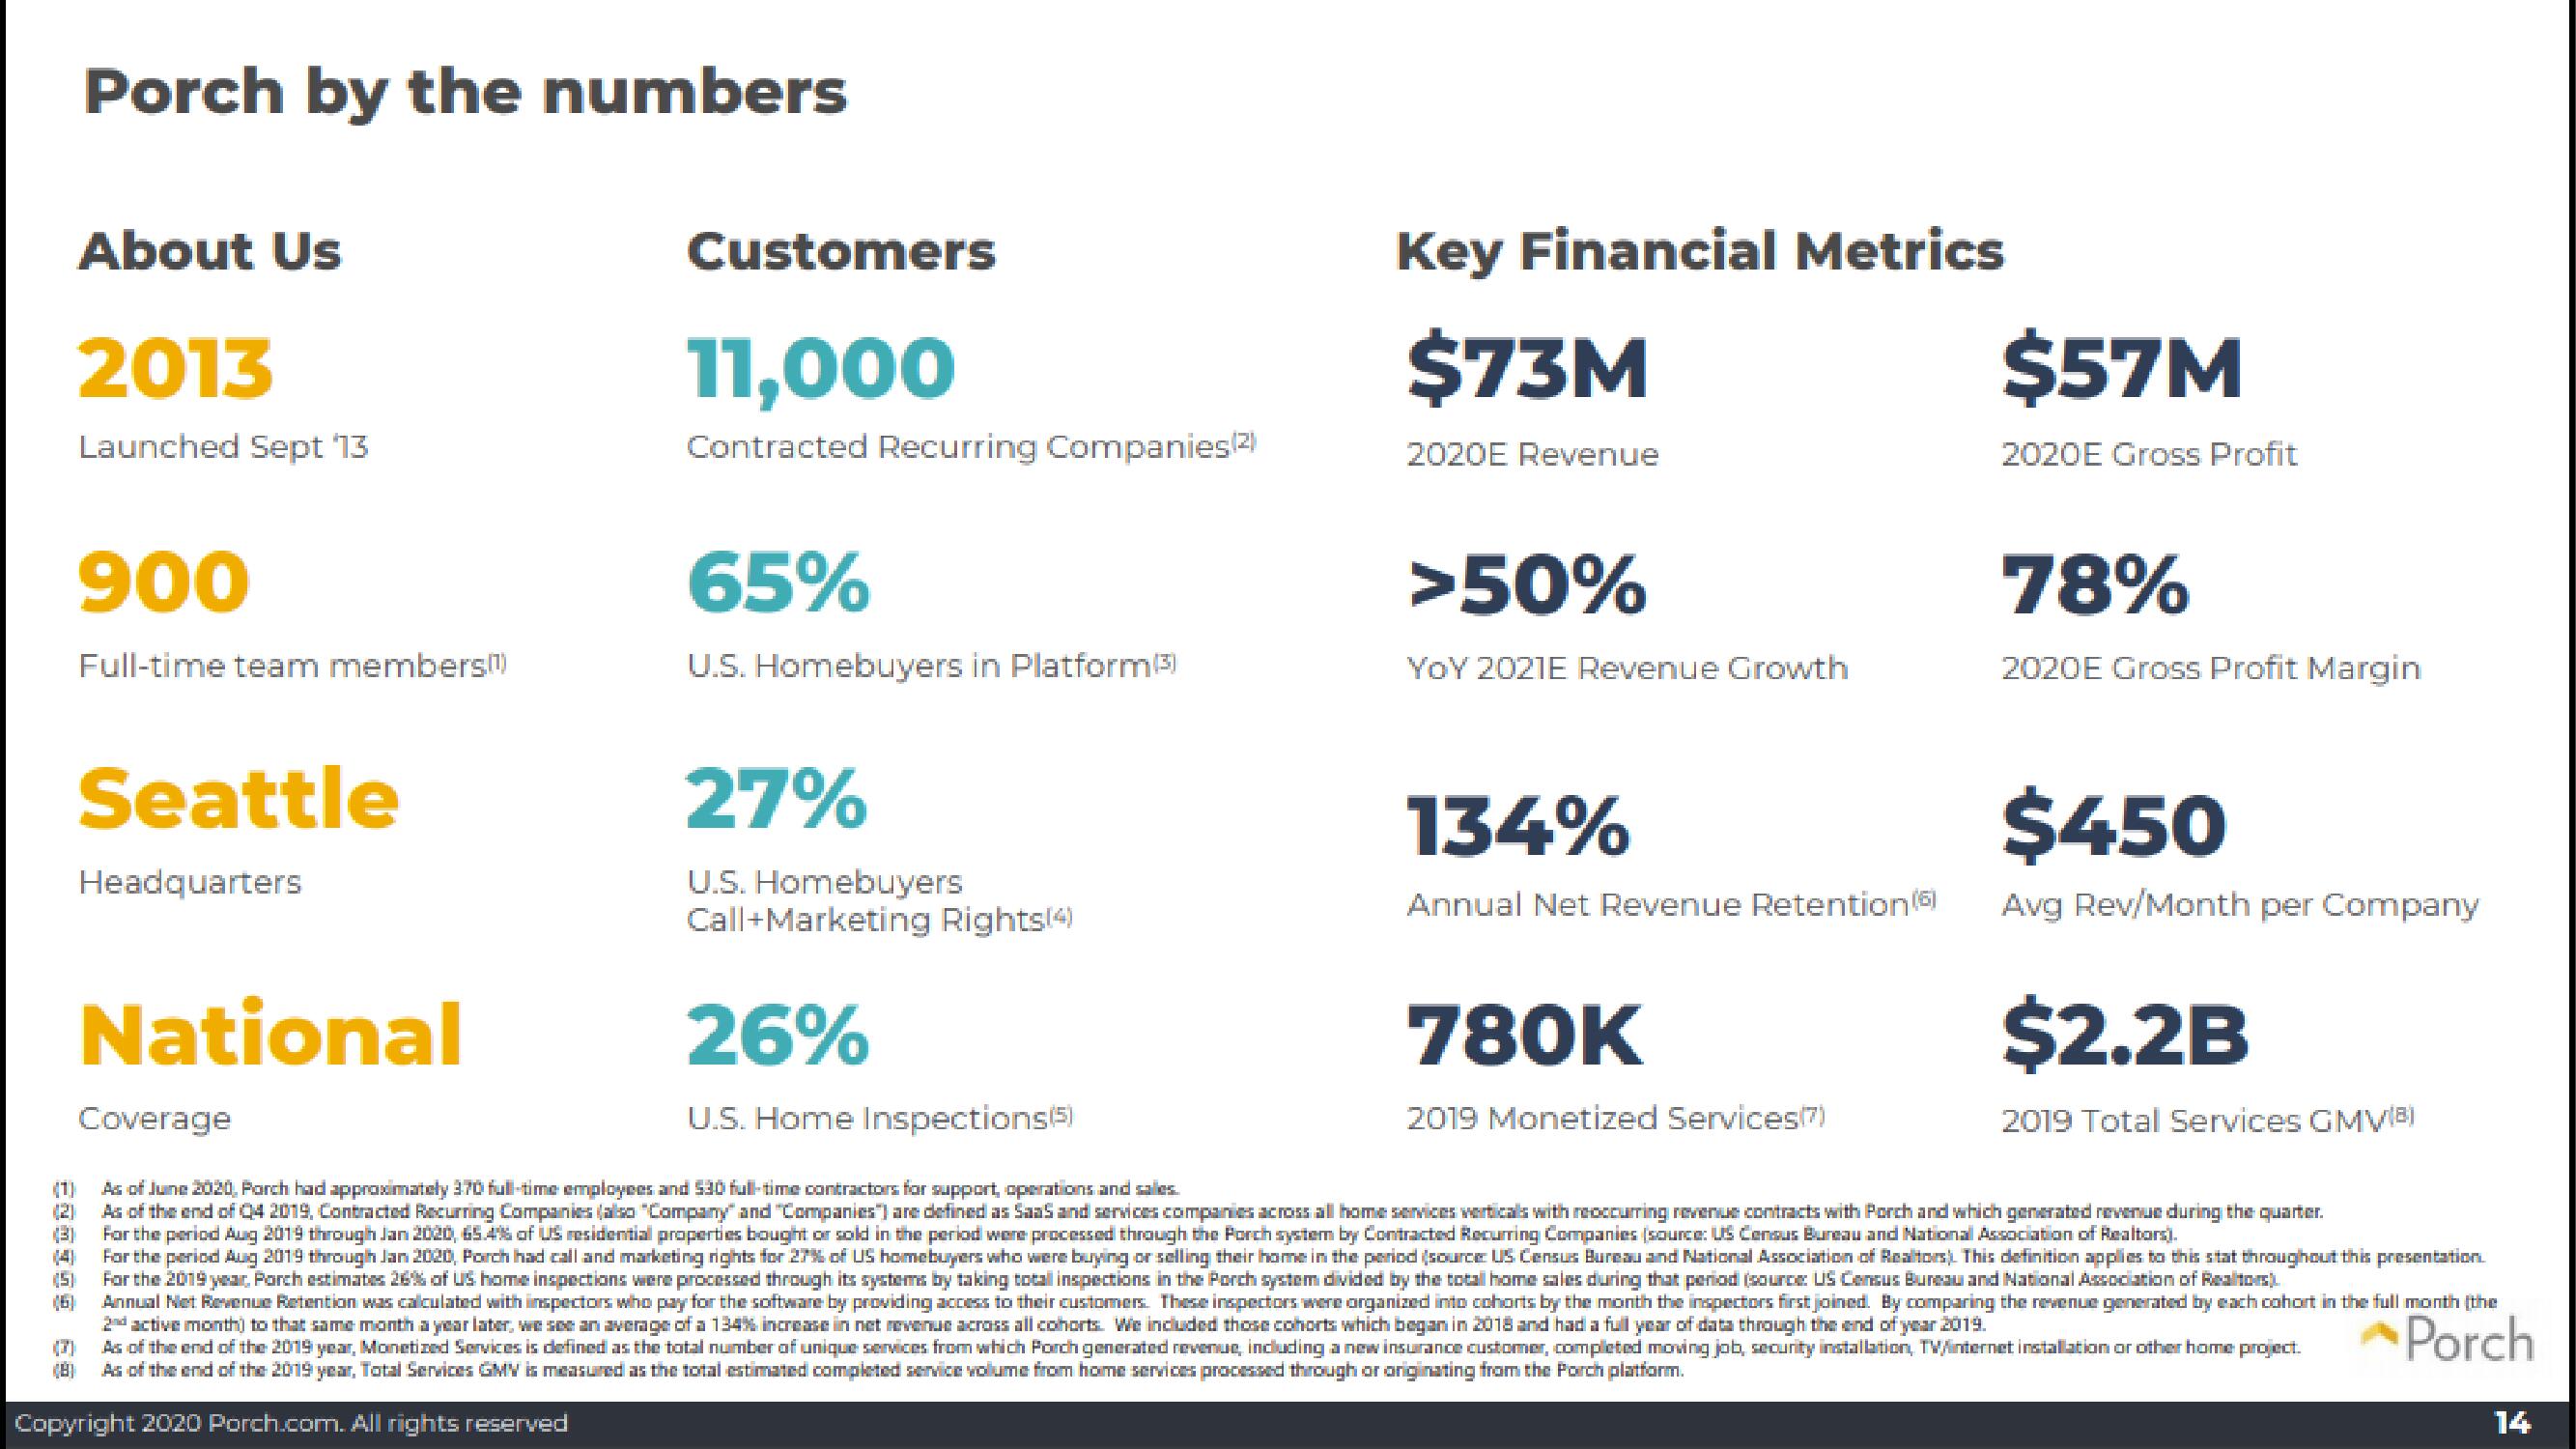
Porch by the numbers
68
About Us
2013
Launched Sept '13
900
Full-time team members.)
Seattle
Headquarters
National
Coverage
Customers
11,000
Contracted Recurring Companies(2)
65%
U.S. Homebuyers in Platform(3)
27%
U.S. Homebuyers
Call+Marketing Rights(4)
26%
U.S. Home Inspections (5)
Key Financial Metrics
$73M
2020E Revenue
>50%
YOY 2021E Revenue Growth
134%
Annual Net Revenue Retention (6)
780K
2019 Monetized Services(7)
$57M
2020E Gross Profit
As of June 2020, Porch had approximately 970 full-time employees and 530 full-time contractors for support, operations and sales.
As of the end of Q4 2019, Contracted Recurring Companies (also "Company" and "Companies") are defined as SaaS and services companies across all home services verticals with reoccurring revenue contracts with Porch and which generated revenue during the quarter.
For the period Aug 2019 through Jan 2020, 65.4% of US residential properties bought or sold in the period were processed through the Porch system by Contracted Recurring Companies (source: US Census Bureau and National Association of Realtors).
For the period Aug 2019 through Jan 2020, Porch had call and marketing rights for 27% of US homebuyers who were buying or selling their home in the period (source: US Census Bureau and National Association of Realtors). This definition applies to this stat throughout this presentation.
For the 2019 year, Porch estimates 26% of US home inspections were processed through its systems by taking total inspections in the Porch system divided by the totall home sales during that period (source: US Census Bureau and National Association of Realtors).
Annual Net Revenue Retention was calculated with inspectors who pay for the software by providing access to their customers. These inspectors were organized into cohorts by the month the inspectors first joined. By comparing the revenue generated by each cohort in the full month (the
2nd active month) to that same month a year later, we see an average of a 134% increase in net revenue across all cohorts. We included those cohorts which began in 2018 and had a full year of data through the end of year 2019.
As of the end of the 2019 year, Monetized Services is defined as the total number of unique services from which Porch generated revenue, including a new insurance customer, completed moving job, security installation, TV/internet installation or other home project.
As of the end of the 2019 year, Total Services GMV is measured as the total estimated completed service volume from home services processed through or originating from the Porch platform.
Porch
Copyright 2020 Porch.com. All rights reserved
78%
2020E Gross Profit Margin
$450
Avg Rev/Month per Company
$2.2B
2019 Total Services GMV(B)
14View entire presentation