Acast Results Presentation Deck
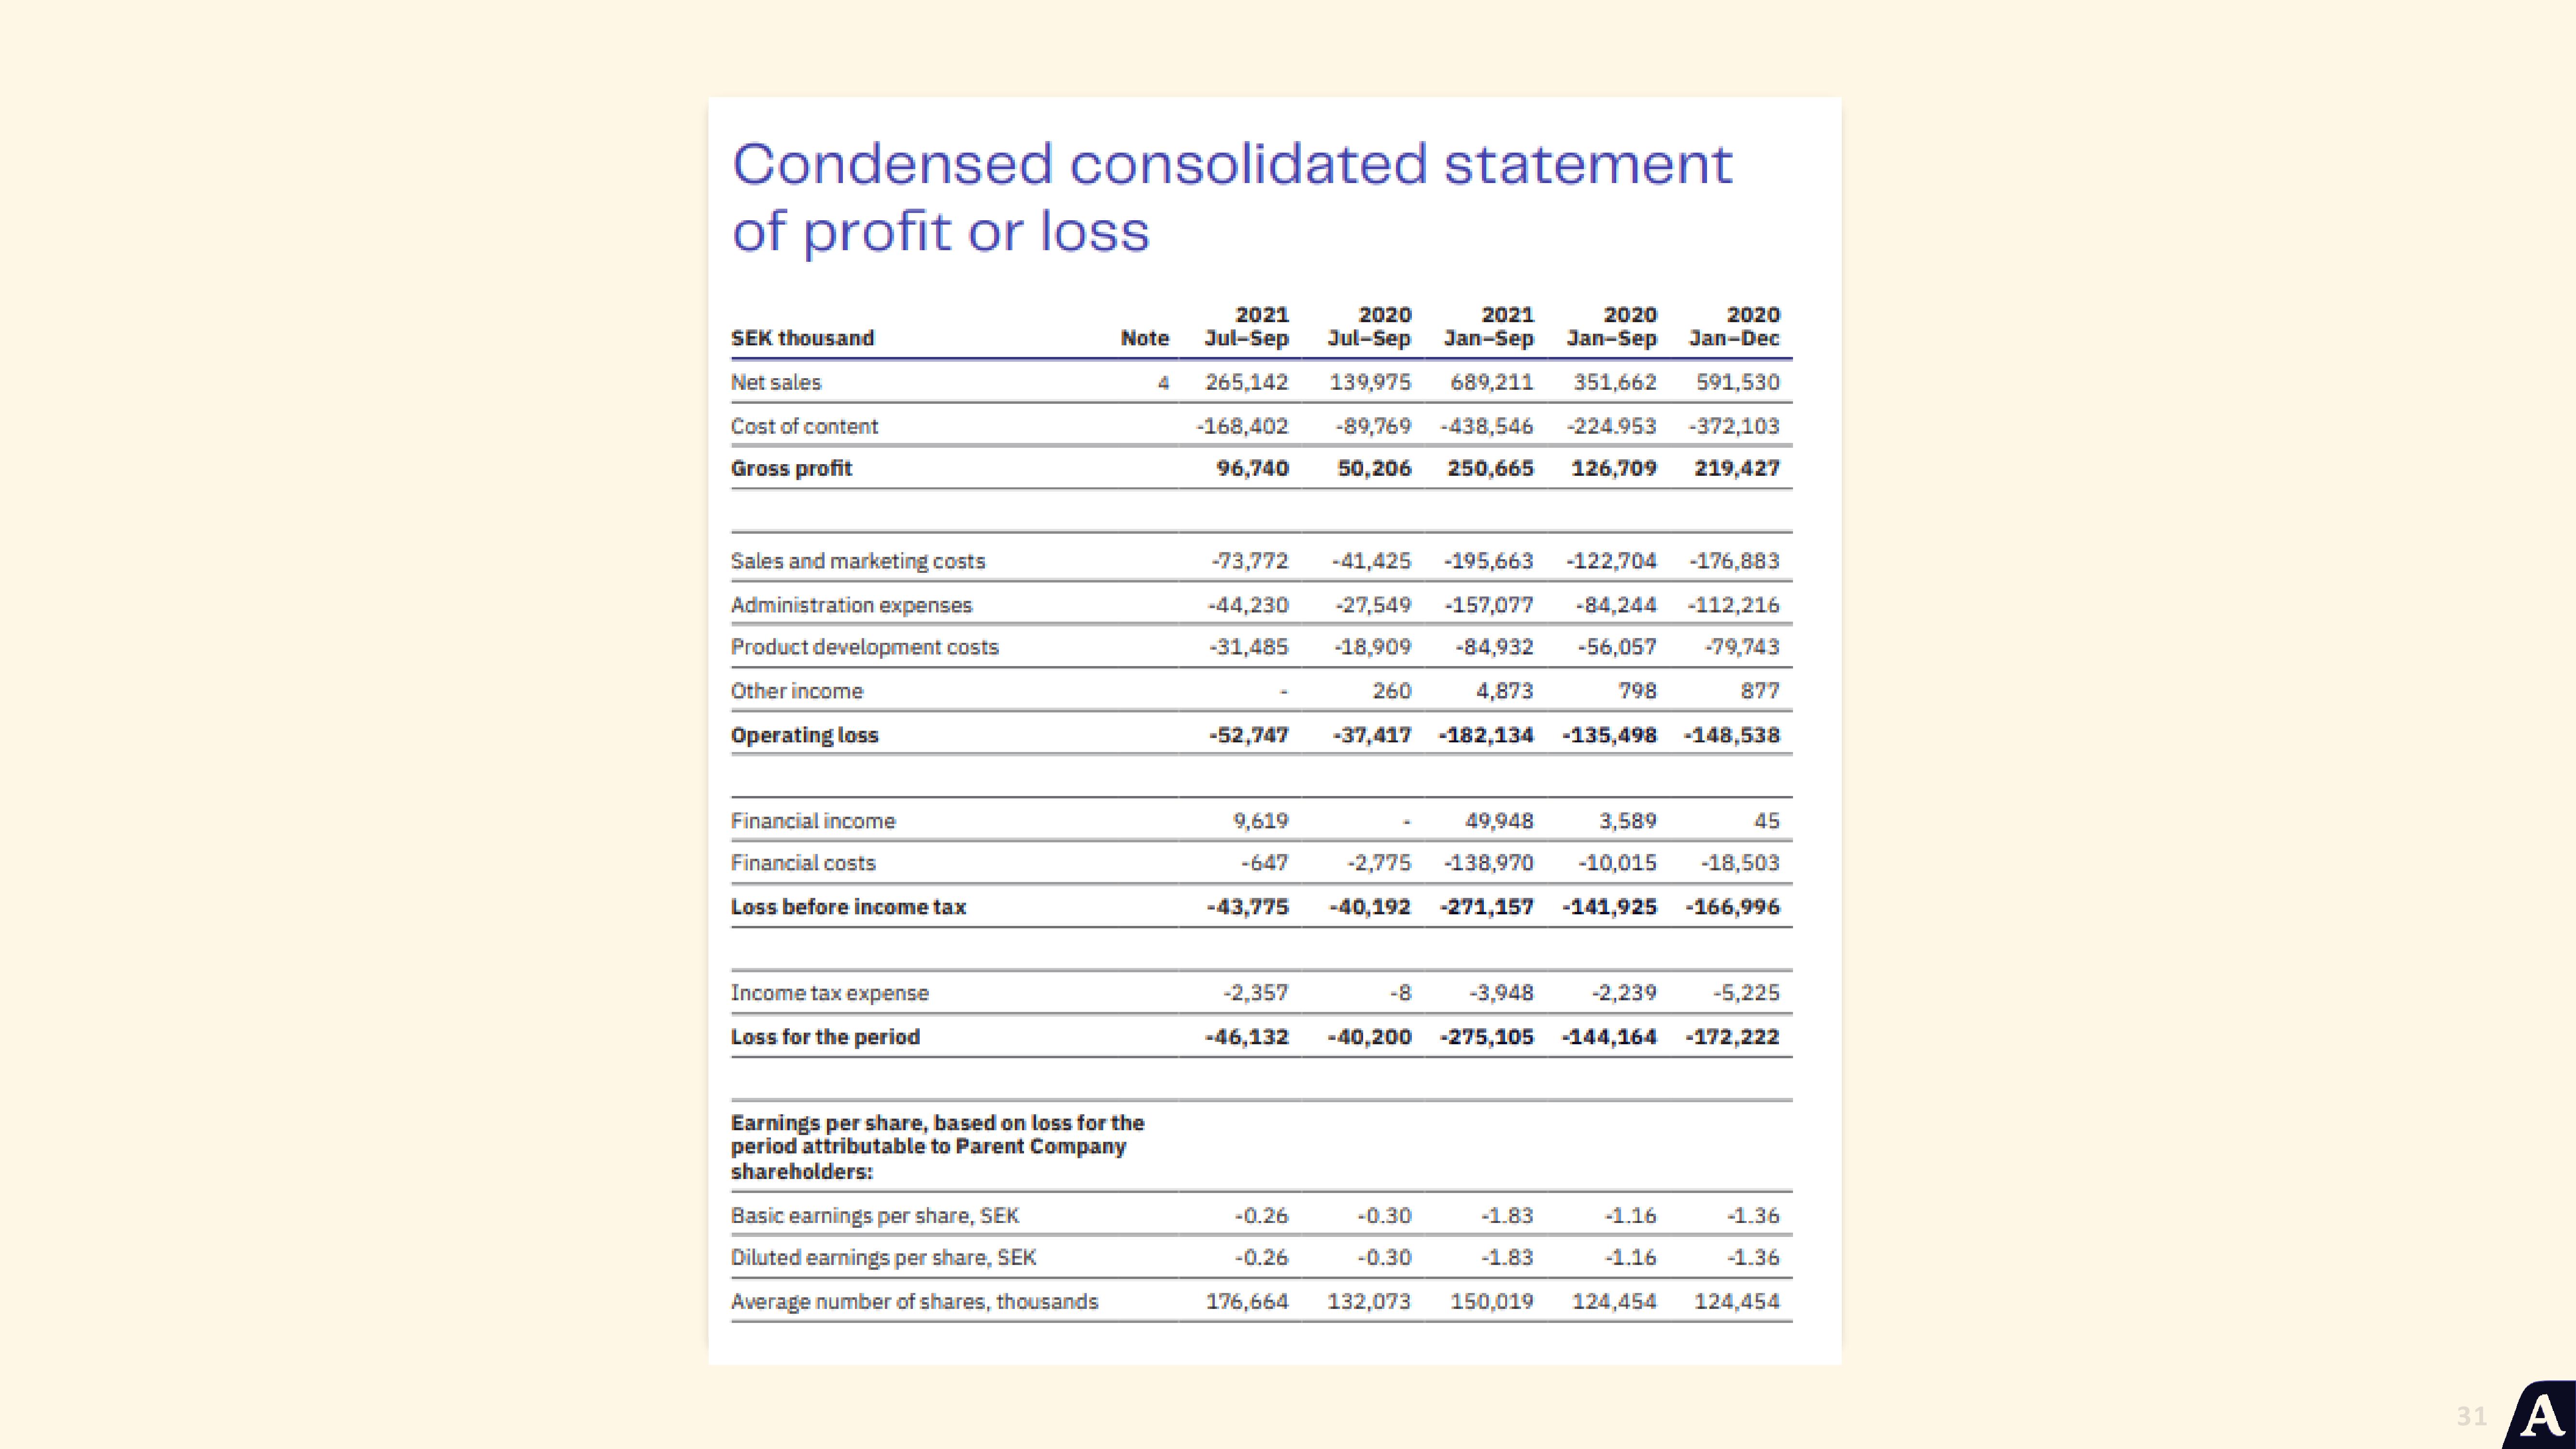
Condensed consolidated statement
of profit or loss
SEK thousand
Net sales
Cost of content
Gross profit
Sales and marketing costs
Administration expenses
Product development costs
Other income
Operating loss
Financial income
Financial costs
Loss before income tax
Income tax expense
Loss for the period
Earnings per share, based on loss for the
period attributable to Parent Company
shareholders:
Basic earnings per share, SEK
Diluted earnings per share, SEK
Average number of shares, thousands
2021
2020
2021
2020
2020
Jul-Sep Jul-Sep Jan-Sep Jan-Sep
Jan-Dec
4 265,142 139,975 689,211 351,662 591,530
-89,769 -438,546 -224.953 -372,103
-168,402
96,740
50,206 250,665 126,709 219,427
Note
-73,772
-44,230
-31,485
-52,747
9,619
-647
-43,775
-41,425 -195,663 -122,704 -176,883
-27,549 -157,077 -84,244 -112,216
-18,909 -84,932 -56,057 -79,743
260 4,873
-37,417 -182,134 -135,498 -148,538
-0.26
-0.26
176,664
798
877
-8
49,948 3,589
-2,775 -138,970 -10,015 -18,503
-40,192 -271,157 -141,925 -166,996
45
-2,357
-3,948 -2,239 -5,225
-46,132 -40,200 -275,105 -144,164 -172,222
-0.30
-1.36
-1.83
-1.83
-1.16
-1.16
-1.36
-0.30
132,073 150,019 124,454 124,454
31 AView entire presentation