SPAC Presentation
Procaps at a Glance
Track Record of Strong Growth, Margin Expansion and High ROIC
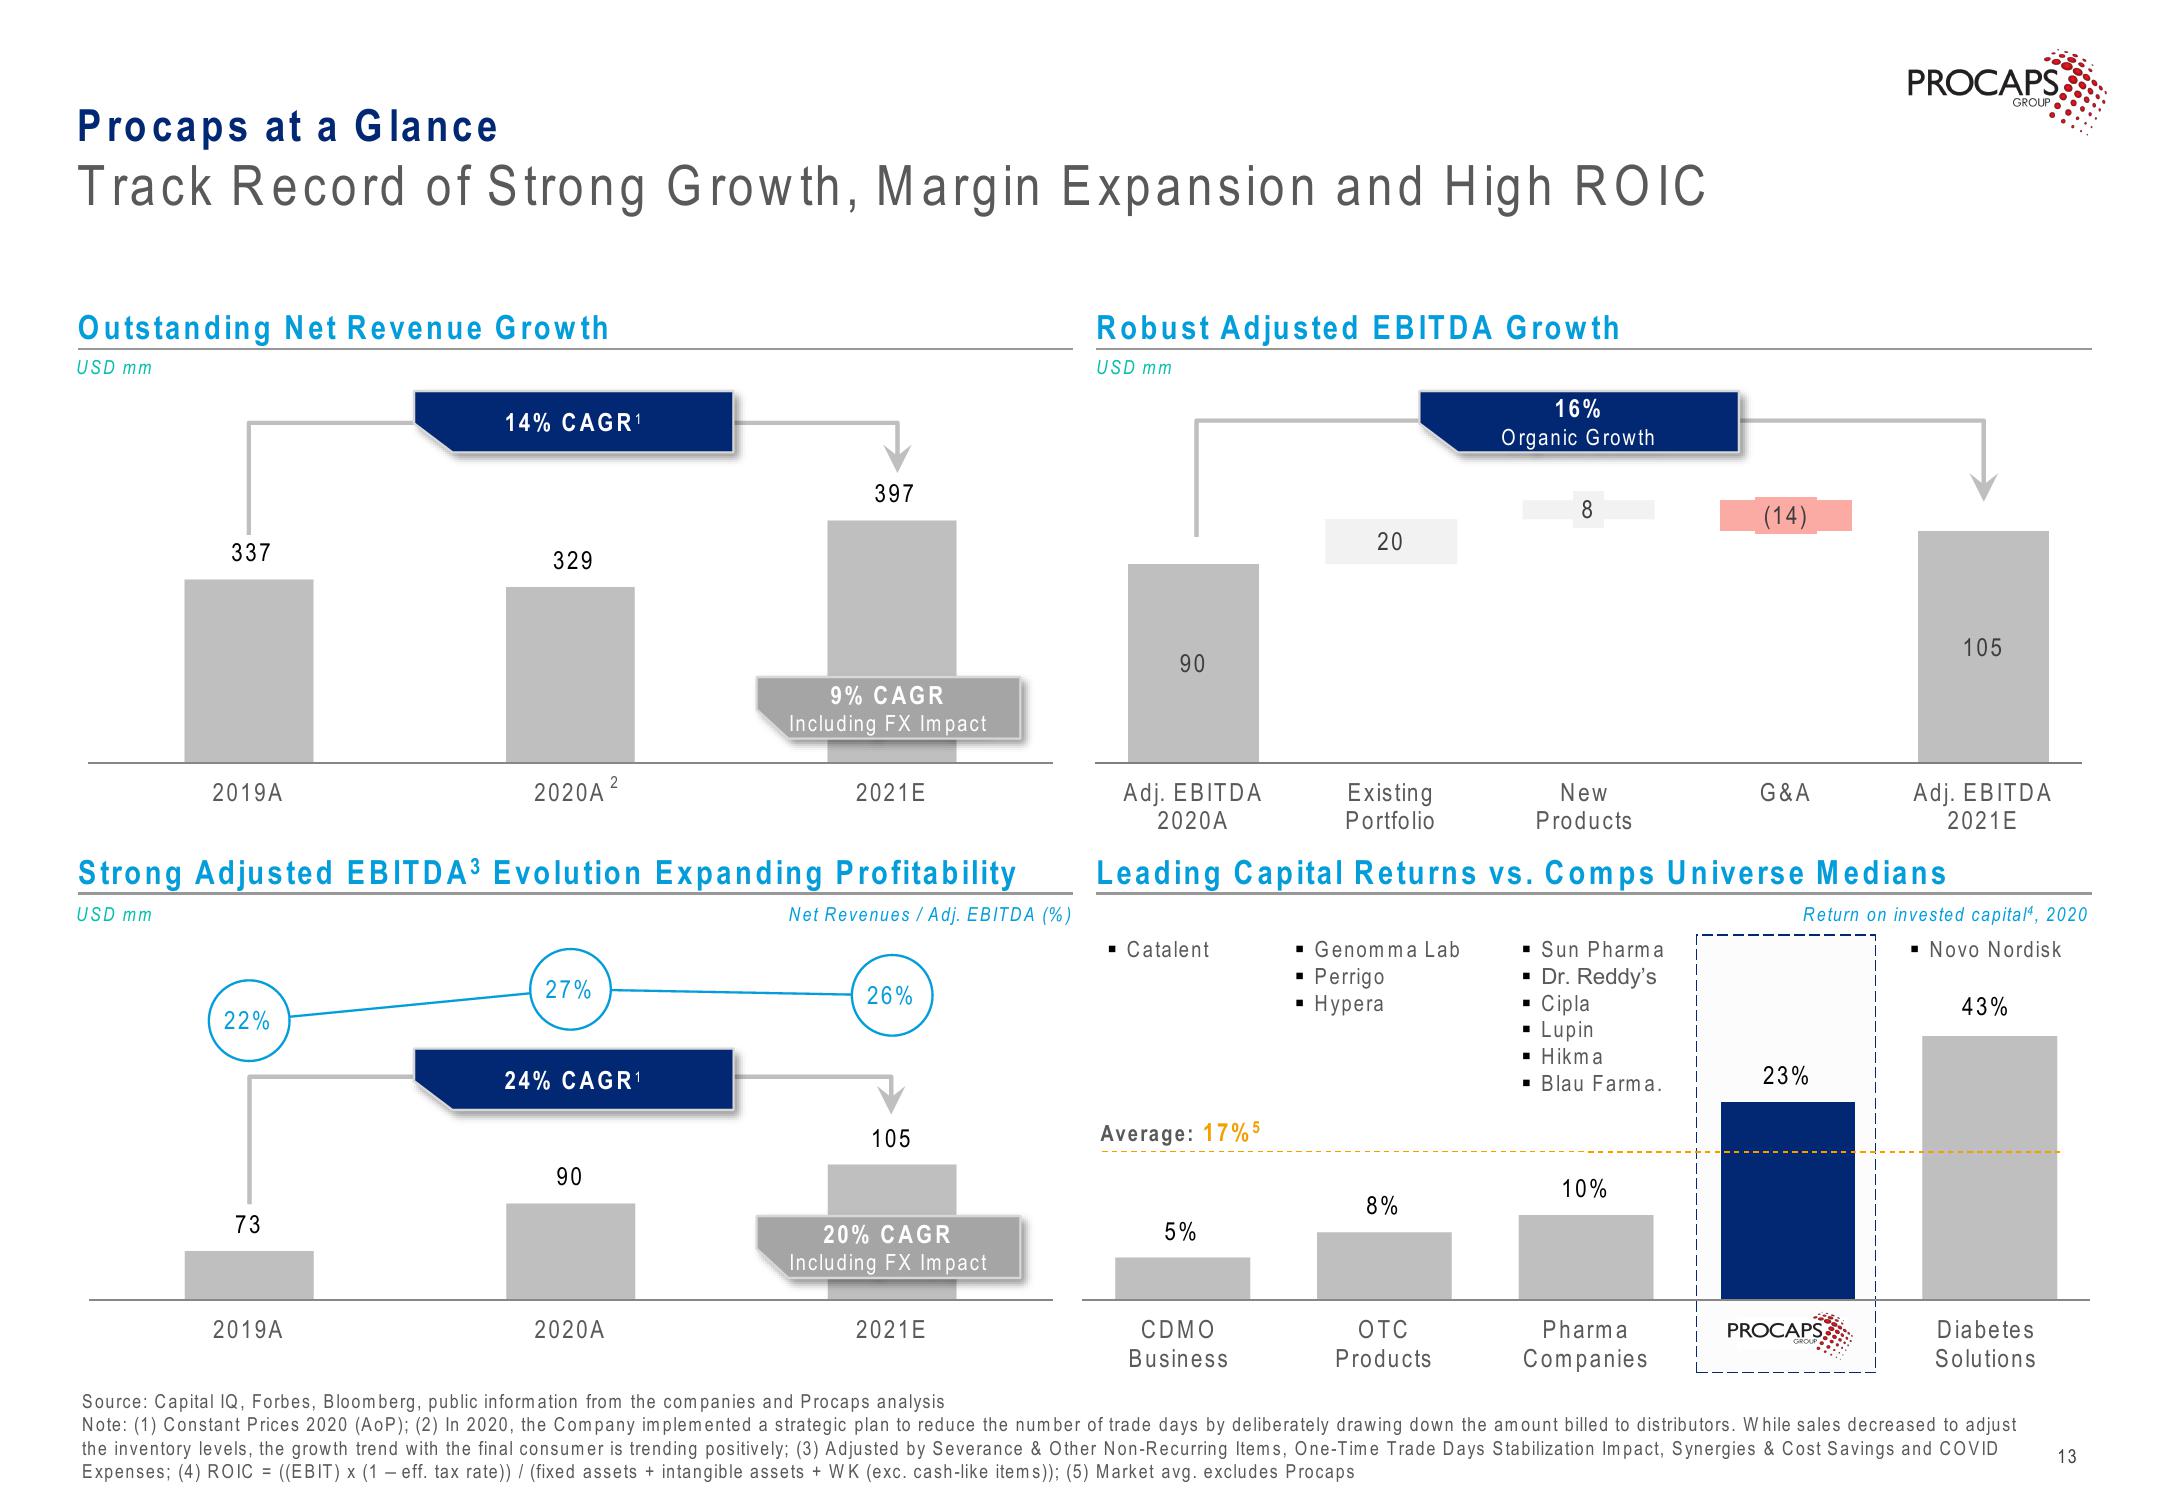
Outstanding Net Revenue Growth
USD mm
337
2019A
22%
73
14% CAGR¹
2019A
329
2020A
Strong Adjusted EBITDA³ Evolution Expanding Profitability
USD mm
Net Revenues / Adj. EBITDA (%)
27%
2
24% CAGR ¹
90
2020A
397
9% CAGR
Including FX Impact
2021E
26%
105
20% CAGR
Including FX Impact
2021E
Robust Adjusted EBITDA Growth
USD mm
90
Adj. EBITDA
2020A
▪ Catalent
Average: 17% 5
5%
CDMO
Business
I
20
■
Existing
Portfolio
Leading Capital Returns vs. Comps Universe Medians
Genomma Lab
Perrigo
Hypera
8%
16%
Organic Growth
OTC
Products
8
New
Products
▪ Sun Pharma
▪ Dr. Reddy's
I
■
Cipla
Lupin
▪ Hikma
Blau Farma.
10%
(14)
Pharma
Companies
G&A
PROCAPS
23%
PROCAPS,
105
Adj. EBITDA
2021E
GROUP
Return on invested capital, 2020
▪ Novo Nordisk
43%
Diabetes
Solutions
*
Source: Capital IQ, Forbes, Bloomberg, public information from the companies and Procaps analysis
Note: (1) Constant Prices 2020 (AOP); (2) In 2020, the Company implemented a strategic plan to reduce the number of trade days by deliberately drawing down the amount billed to distributors. While sales decreased to adjust
the inventory levels, the growth trend with the final consumer is trending positively; (3) Adjusted by Severance & Other Non-Recurring Items, One-Time Trade Days Stabilization Impact, Synergies & Cost Savings and COVID
Expenses; (4) ROIC = ((EBIT) x (1 - eff. tax rate)) / (fixed assets + intangible assets + WK (exc. cash-like items)); (5) Market avg. excludes Procaps
13View entire presentation