Keysight Technologies Q1 Fiscal Year 2023 Results slide image

Keysight Technologies Q1 Fiscal Year 2023 Results

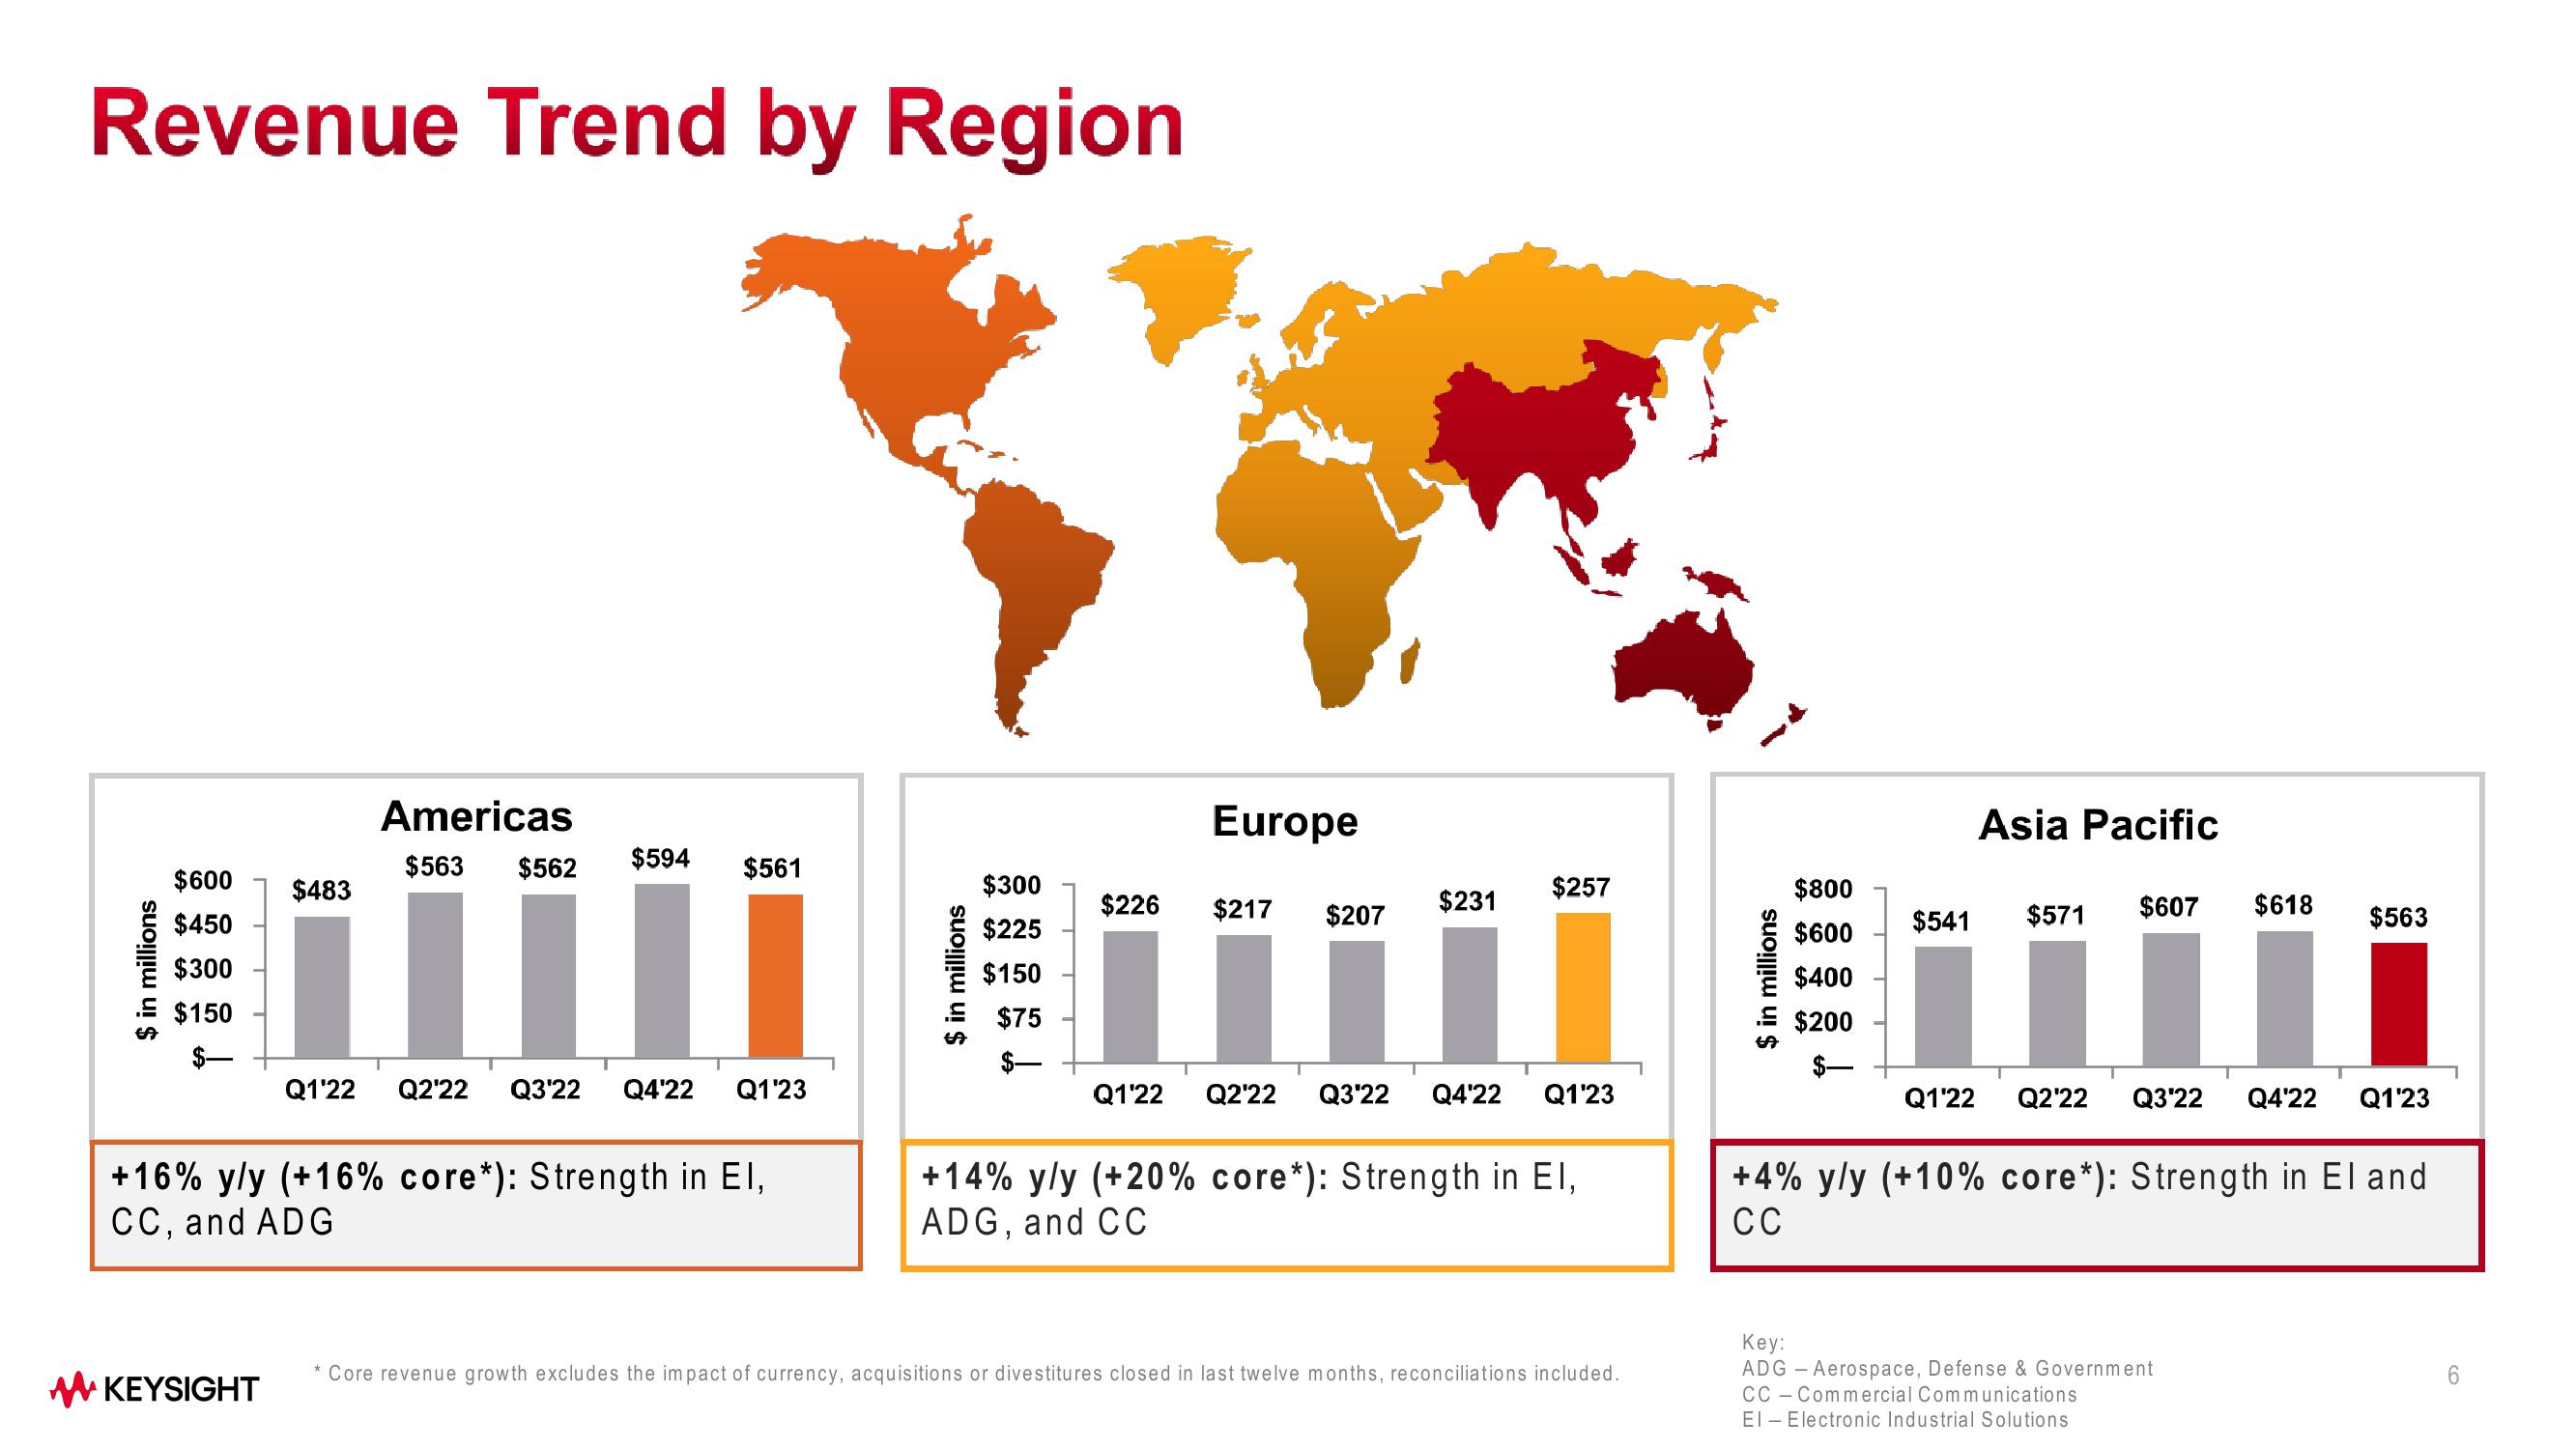
Revenue Trend by Region $ in millions Americas $563 $562 rii Q1'22 Q2'22 Q3'22 Q4'22 Q1'23 $600 $450 $300 $150 $483 ✔KEYSIGHT $594 $561 +16% y/y (+16% core*): Strength in EI, CC, and ADG $ in millions $300 $225 $150 $75 $226 Europe $217 $207 $231 $257 Q1'22 Q2'22 Q3'22 Q4'22 Q1'23 +14% y/y (+20% core*): Strength in El, ADG, and CC * Core revenue growth excludes the impact of currency, acquisitions or divestitures closed in last twelve months, reconciliations included. $800 $600 $400 € $200 $ in millions $541 Asia Pacific $607 $571 $618 $563 Q1'22 Q2'22 Q3'22 Q4'22 Q1'23 Key: ADG - Aerospace, Defense & Government CC Commercial Communications El Electronic Industrial Solutions +4% y/y (+10% core*): Strength in El and CC 6
View entire presentation