Kinnevik Results Presentation Deck
UNDER CERTAIN CIRCUMSTANCES WE REFLECT PRIVATE MARKET INERTIA RELATIVE
TO PUBLIC MARKETS BY MUTING UPWARDS AND DOWNWARDS PEER MOVEMENTS
■
H
■
I
We seek to reflect the development of public markets, all the while
being mindful of the fact that investors take different approaches to
valuing more established publicly listed businesses relative to high-
growth private businesses
■
■
Peer Sets
Premiums & Discounts
■
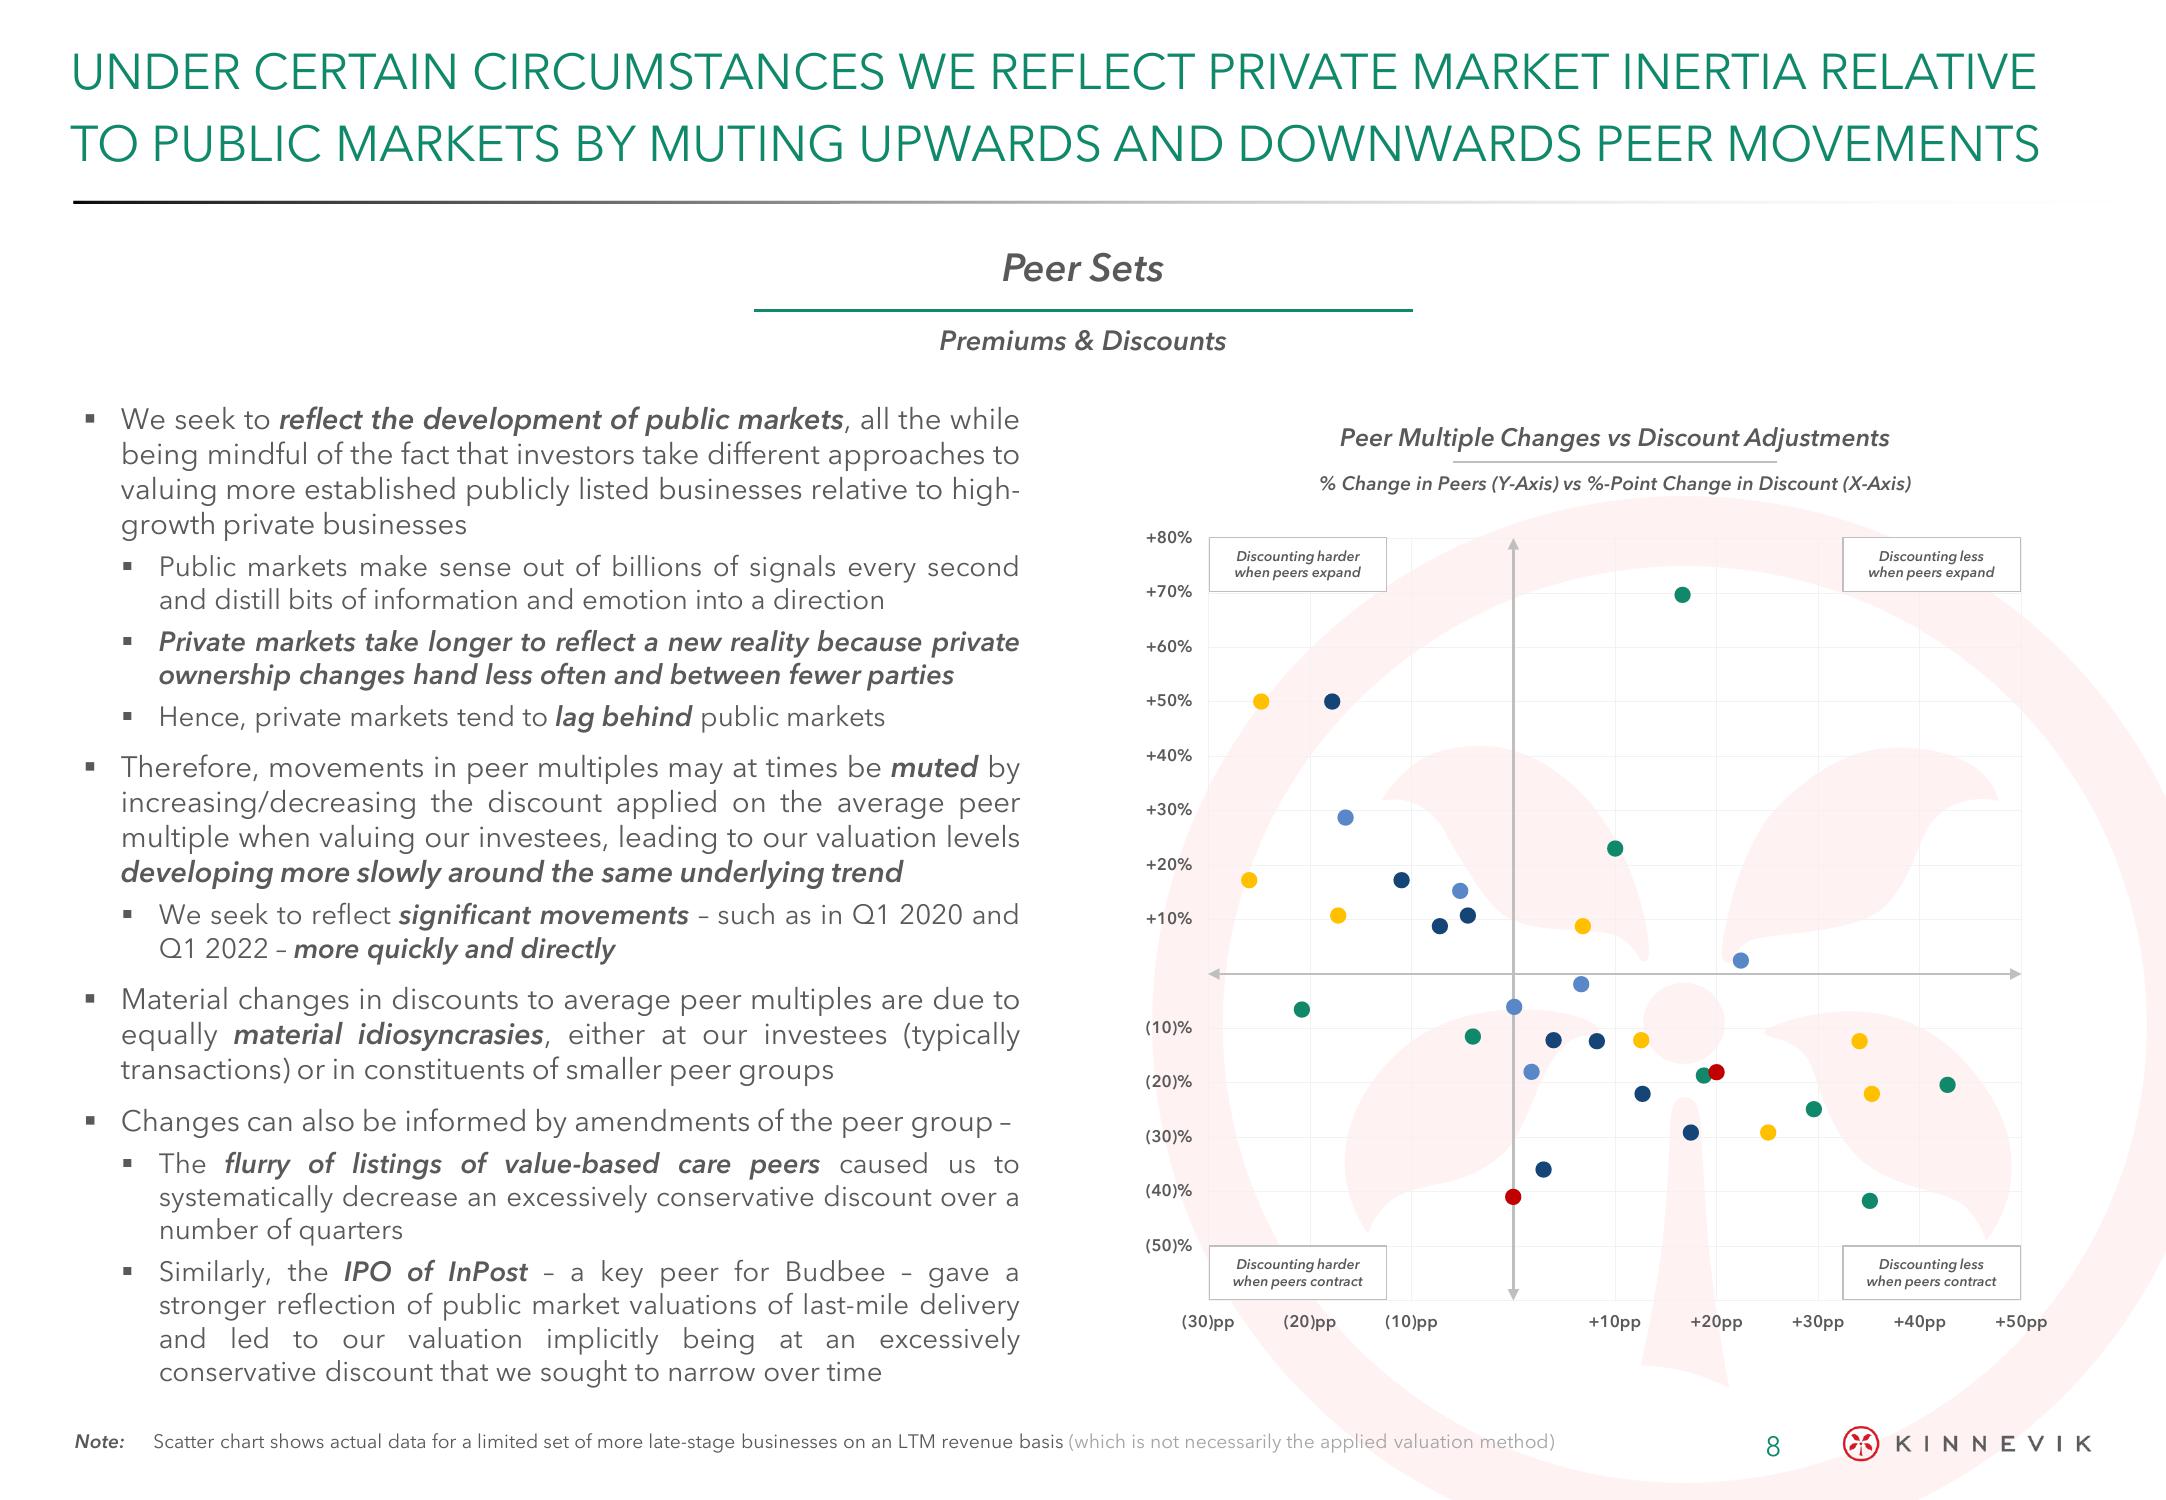
Therefore, movements in peer multiples may at times be muted by
increasing/decreasing the discount applied on the average peer
multiple when valuing our investees, leading to our valuation levels
developing more slowly around the underlying trend
■
Public markets make sense out of billions of signals every second
and distill bits of information and emotion into a direction
Note:
Private markets take longer to reflect a new reality because private
ownership changes hand less often and between fewer parties
Hence, private markets tend to lag behind public markets
Material changes in discounts to average peer multiples are due to
equally material idiosyncrasies, either at our investees (typically
transactions) or in constituents of smaller peer groups
Changes can also be informed by amendments of the peer group -
The flurry of listings of value-based care peers caused us to
systematically decrease an excessively conservative discount over a
number of quarters
We seek to reflect significant movements such as in Q1 2020 and
Q1 2022 - more quickly and directly
Similarly, the IPO of InPost a key peer for Budbee gave a
stronger reflection of public market valuations of last-mile delivery
and led to our valuation implicitly being at an excessively
conservative discount that we sought to narrow over time
+80%
+70%
+60%
+50%
+40%
+30%
+20%
+10%
(10)%
(20)%
(30)%
(40)%
(50)%
Peer Multiple Changes vs Discount Adjustments
% Change in Peers (Y-Axis) vs %-Point Change in Discount (X-Axis)
Discounting harder
when peers expand
Discounting harder
when peers contract
(30)pp
(20)pp (10)pp
Scatter chart shows actual data for a limited set of more late-stage businesses on an LTM revenue basis (which is not necessarily the applied valuation method)
+10pp
+20pp
8
+30pp
Discounting less
when peers expand
Discounting less
when peers contract
+40pp
+50pp
KINNEVIKView entire presentation