Hydrofarm IPO Presentation Deck
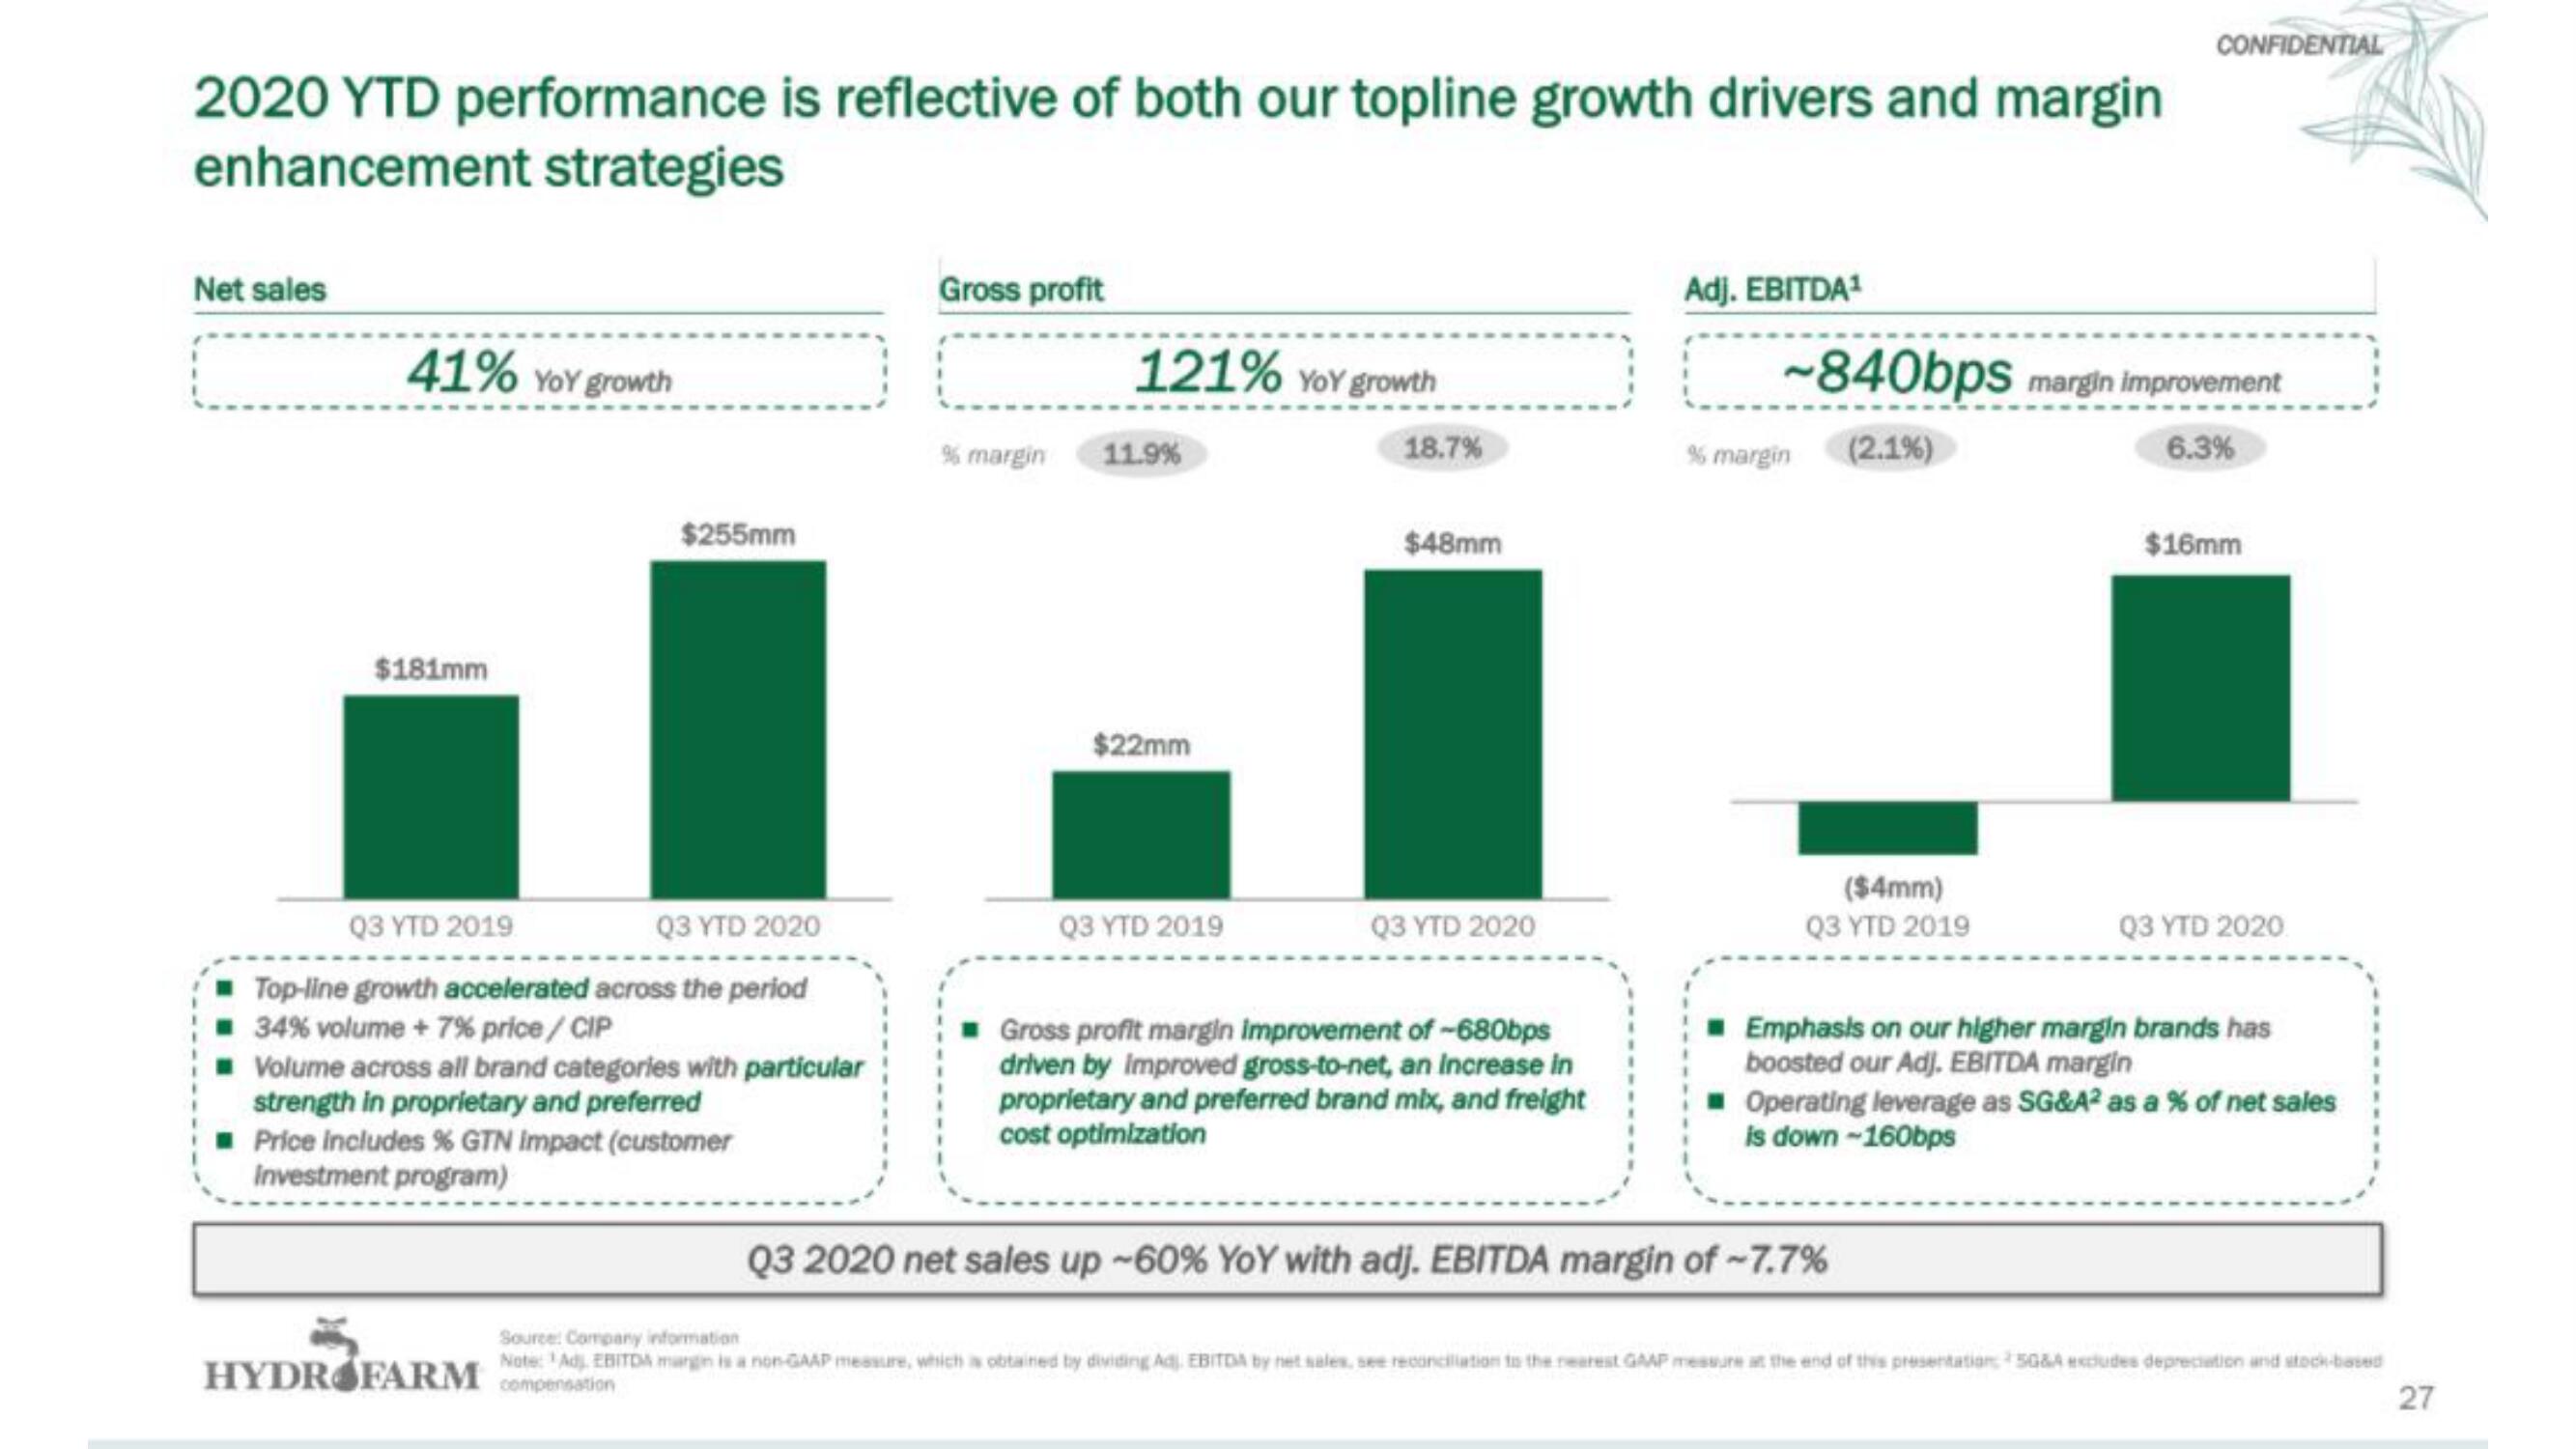
2020 YTD performance is reflective of both our topline growth drivers and margin
enhancement strategies
Net sales
41% YoY growth
$181mm
$255mm
Q3 YTD 2019
Q3 YTD 2020
Top-line growth accelerated across the period
34% volume + 7% price/CIP
Volume across all brand categories with particular
strength in proprietary and preferred
Price includes % GTN Impact (customer
Investment program)
HYDROFARM compensation
Gross profit
% margin
121% YoY growth
11.9%
$22mm
Q3 YTD 2019
18.7%
$48mm
Q3 YTD 2020
Gross profit margin improvement of -680bps
driven by improved gross-to-net, an increase in
proprietary and preferred brand mix, and freight
cost optimization
Adj. EBITDA¹
~840bps margin improvement
(2.1%)
6.3%
% margin
($4mm)
Q3 YTD 2019
CONFIDENTIAL
Q3 2020 net sales up -60% YoY with adj. EBITDA margin of -7.7%
$16mm
Q3 YTD 2020
Emphasis on our higher margin brands has
boosted our Adj. EBITDA margin
Operating leverage as SG&A² as a % of net sales
is down-160bps
Source: Company information
Note: Adj. EBITDA margin is a non-GAAP messure, which is obtained by dividing Adj. EBITDA by net sales, see reconciliation to the rearest GAAP messure at the end of this presentation: 50&A excludes depreciation and stock-based
27View entire presentation