Lordstown Motors Investor Presentation Deck
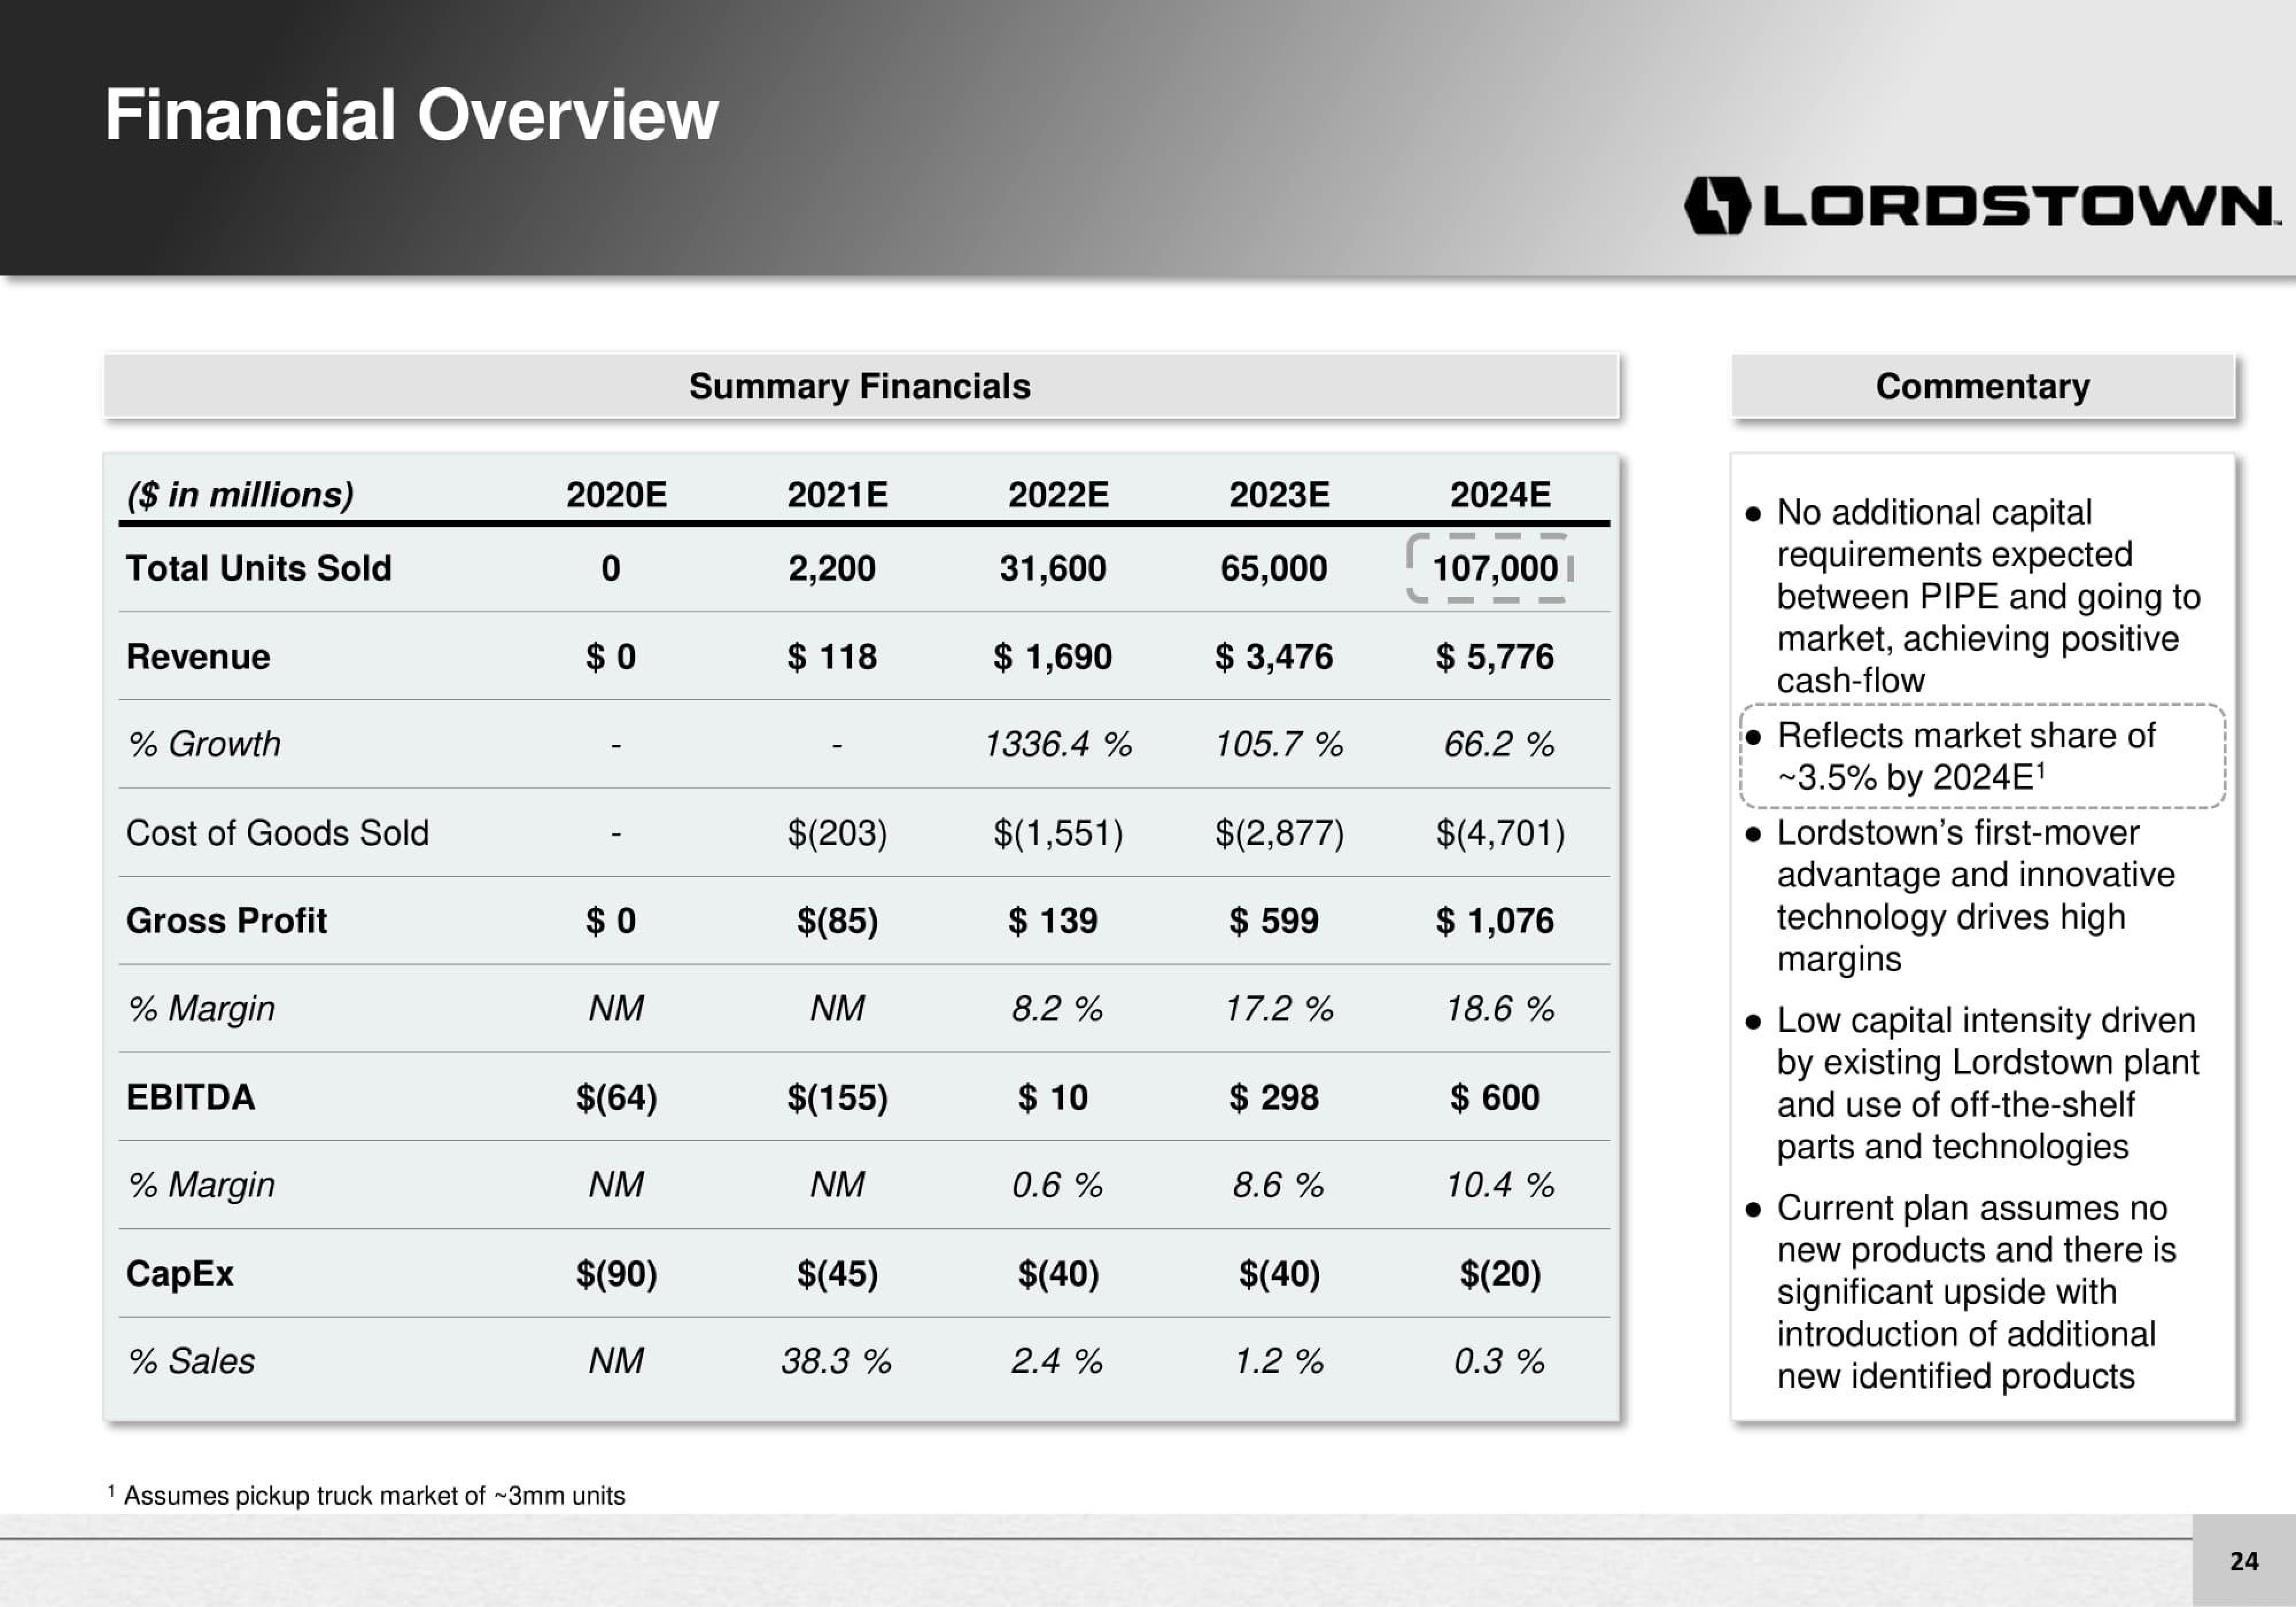
Financial Overview
($ in millions)
Total Units Sold
Revenue
% Growth
Cost of Goods Sold
Gross Profit
% Margin
EBITDA
% Margin
CapEx
% Sales
2020E
0
$0
$0
NM
$(64)
NM
$(90)
NM
1 Assumes pickup truck market of ~3mm units
Summary Financials
2021E
2,200
$ 118
$(203)
$(85)
NM
$(155)
NM
$(45)
38.3 %
2022E
31,600
$ 1,690
1336.4 %
$(1,551)
$ 139
8.2 %
$ 10
0.6 %
$(40)
2.4%
2023E
65,000
$ 3,476
105.7 %
$(2,877)
$ 599
17.2 %
$ 298
8.6 %
$(40)
1.2 %
2024E
107,000
$ 5,776
66.2 %
$(4,701)
$ 1,076
18.6 %
$ 600
10.4 %
$(20)
0.3 %
LORDSTOWN.
Commentary
• No additional capital
requirements expected
between PIPE and going to
market, achieving positive
cash-flow
Reflects market share of
~3.5% by 2024E¹
Lordstown's first-mover
advantage and innovative
technology drives high
margins
• Low capital intensity driven
by existing Lordstown plant
and use of off-the-shelf
parts and technologies
. Current plan assumes no
new products and there is
significant upside with
introduction of additional
new identified products
24View entire presentation