AstraZeneca Results Presentation Deck
Analysis: core operating profit and net debt
Continued improvement in the operating profit mix
$m
2,750
23
2,500
2,250
2,000
1,750
1,500
1,250
1,000
750
500
250
0
Q3 2017
Q4 2017
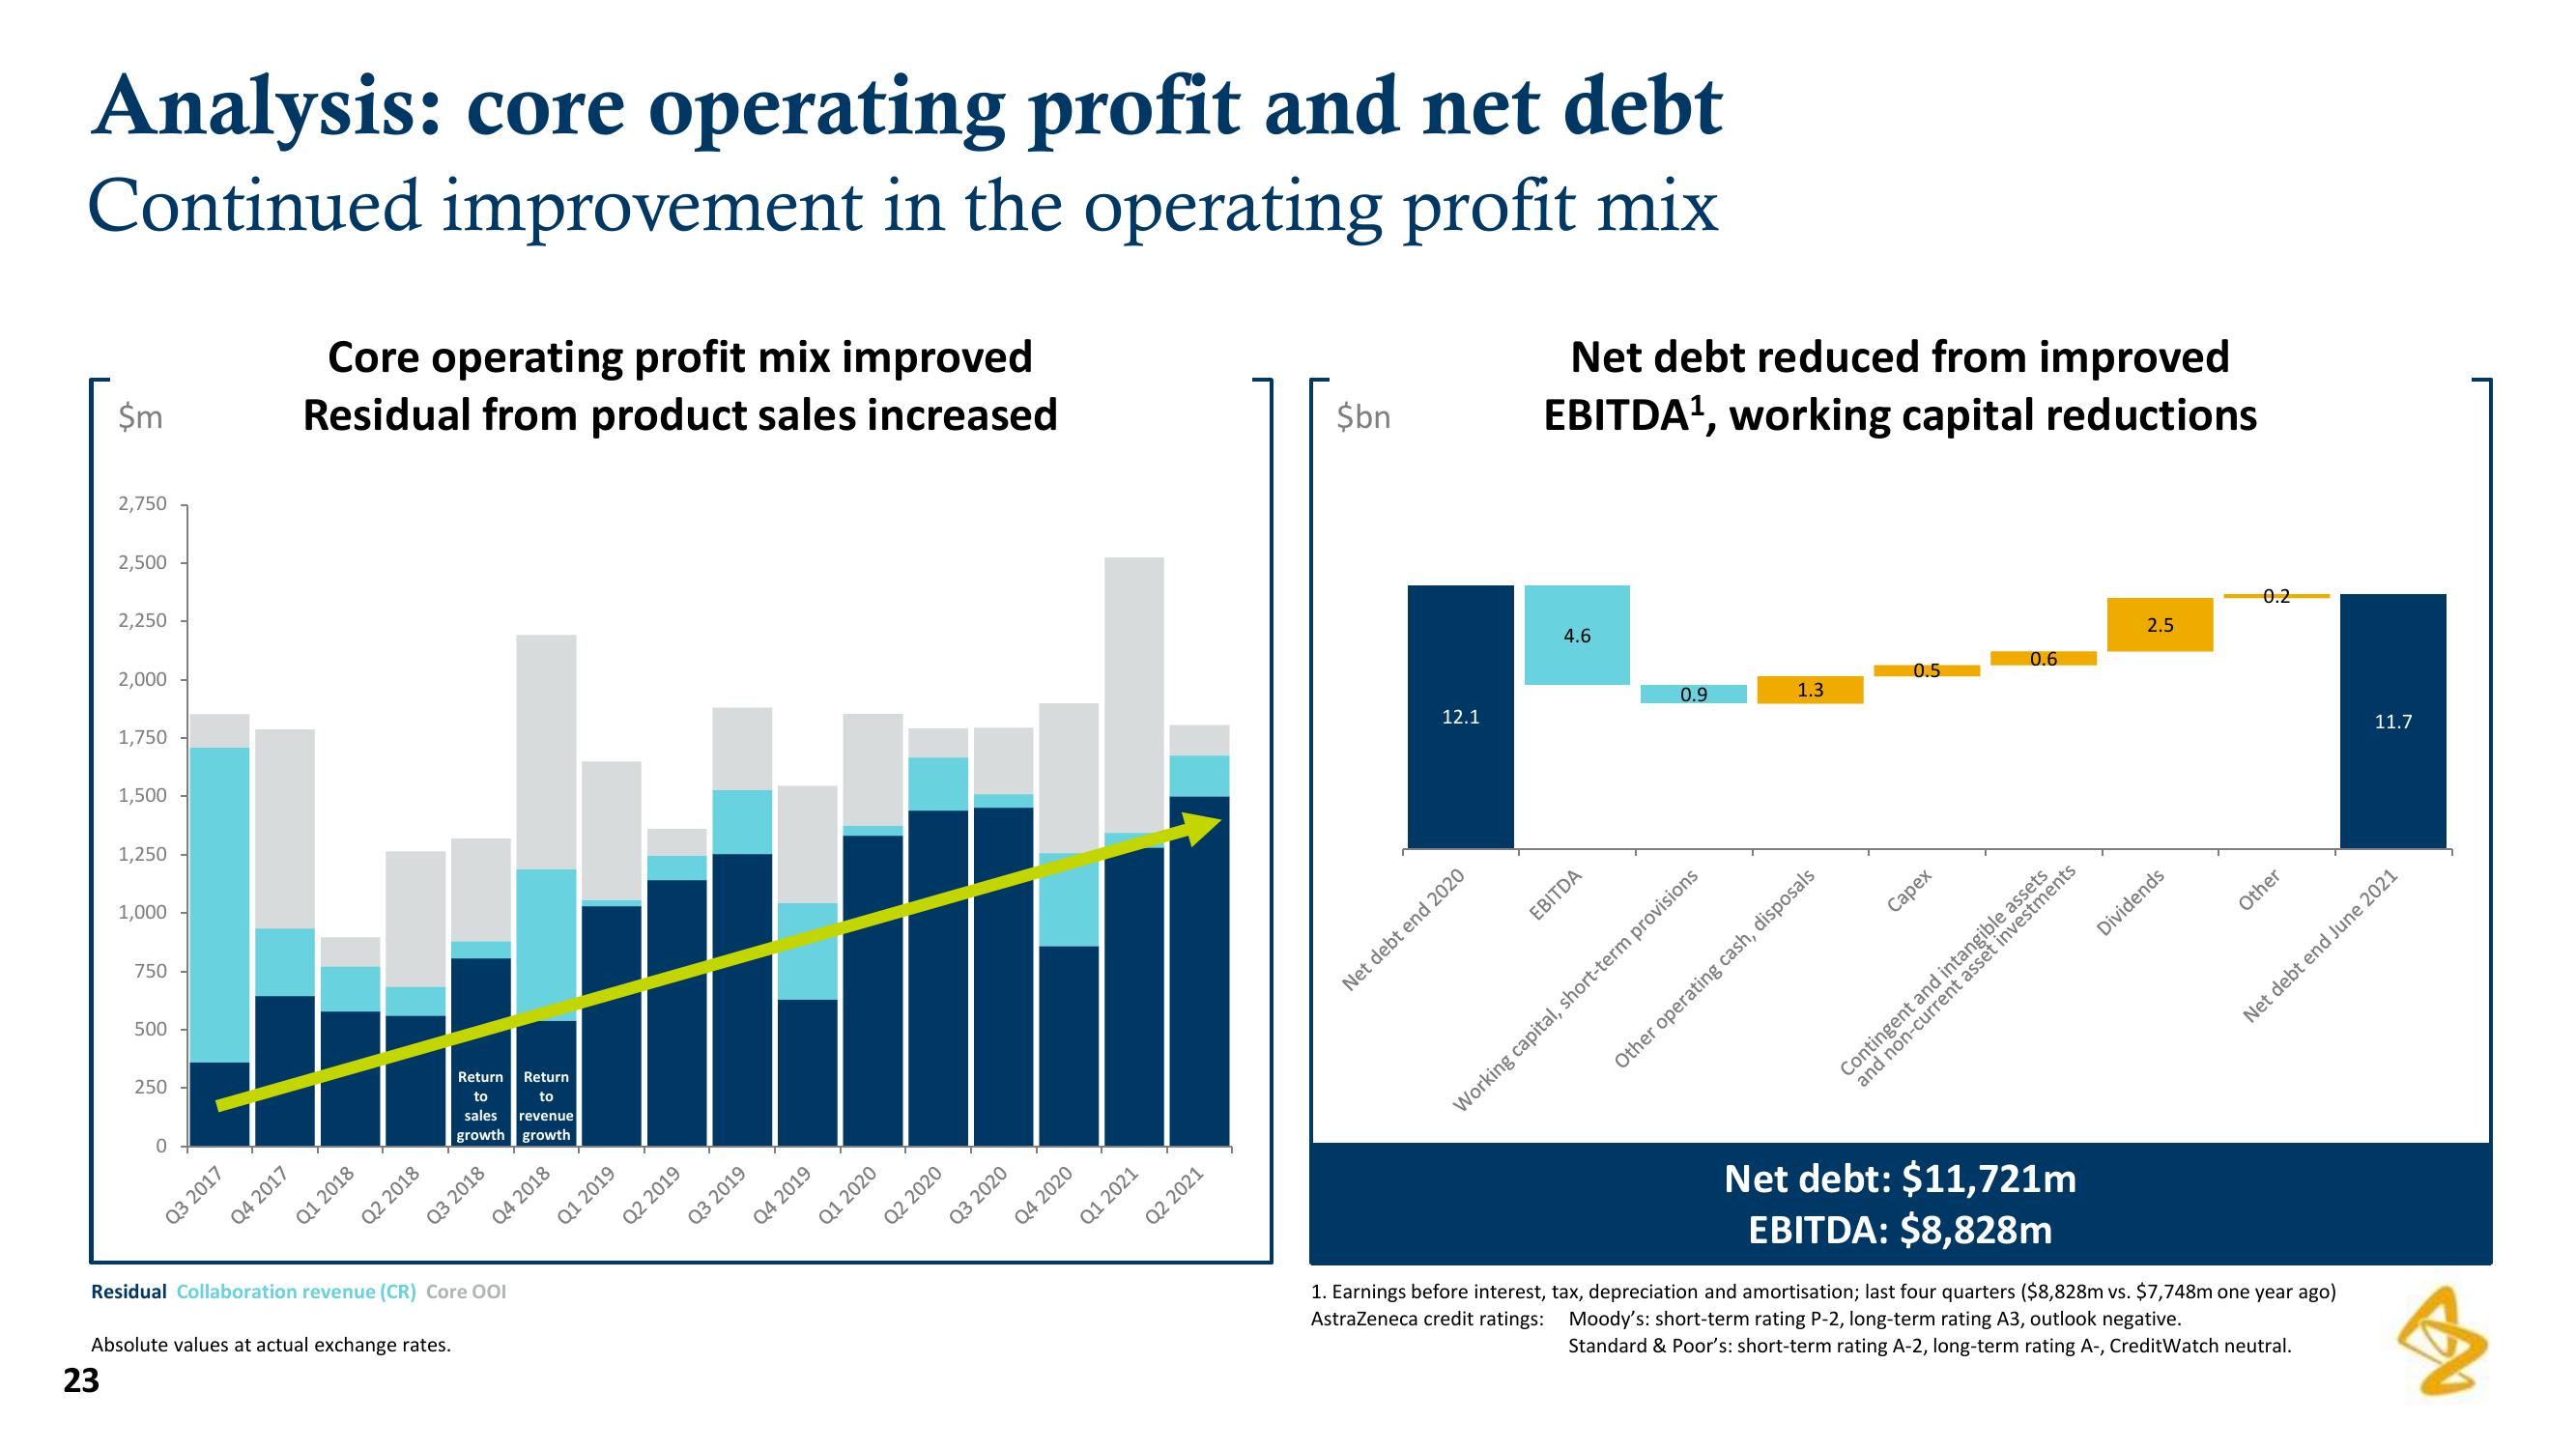
Core operating profit mix improved
Residual from product sales increased
Q1 2018
Q2 2018
Absolute values at actual exchange rates.
Return Return
to
to
sales
revenue
growth growth
Residual Collaboration revenue (CR) Core OOI
Q3 2018
Q4 2018
Q1 2019
Q2 2019
Q3 2019
Q4 2019
Q1 2020
Q2 2020
Q3 2020
Q4 2020
Q1 2021
Q2 2021
$bn
12.1
Net debt end 2020
Net debt reduced from improved
EBITDA¹, working capital reductions
4.6
EBITDA
0.9
Working capital, short-term provisions
1.3
Other operating cash, disposals
0.5
Capex
0.6
and non-current asset investments
Contingent and intangible assets
Net debt: $11,721m
EBITDA: $8,828m
2.5
Dividends
0.2
Other
11.7
Net debt end June 2021
1. Earnings before interest, tax, depreciation and amortisation; last four quarters ($8,828m vs. $7,748m one year ago)
Moody's: short-term rating P-2, long-term rating A3, outlook negative.
AstraZeneca credit ratings:
Standard & Poor's: short-term rating A-2, long-term rating A-, CreditWatch neutral.
3View entire presentation