Kinnevik Results Presentation Deck
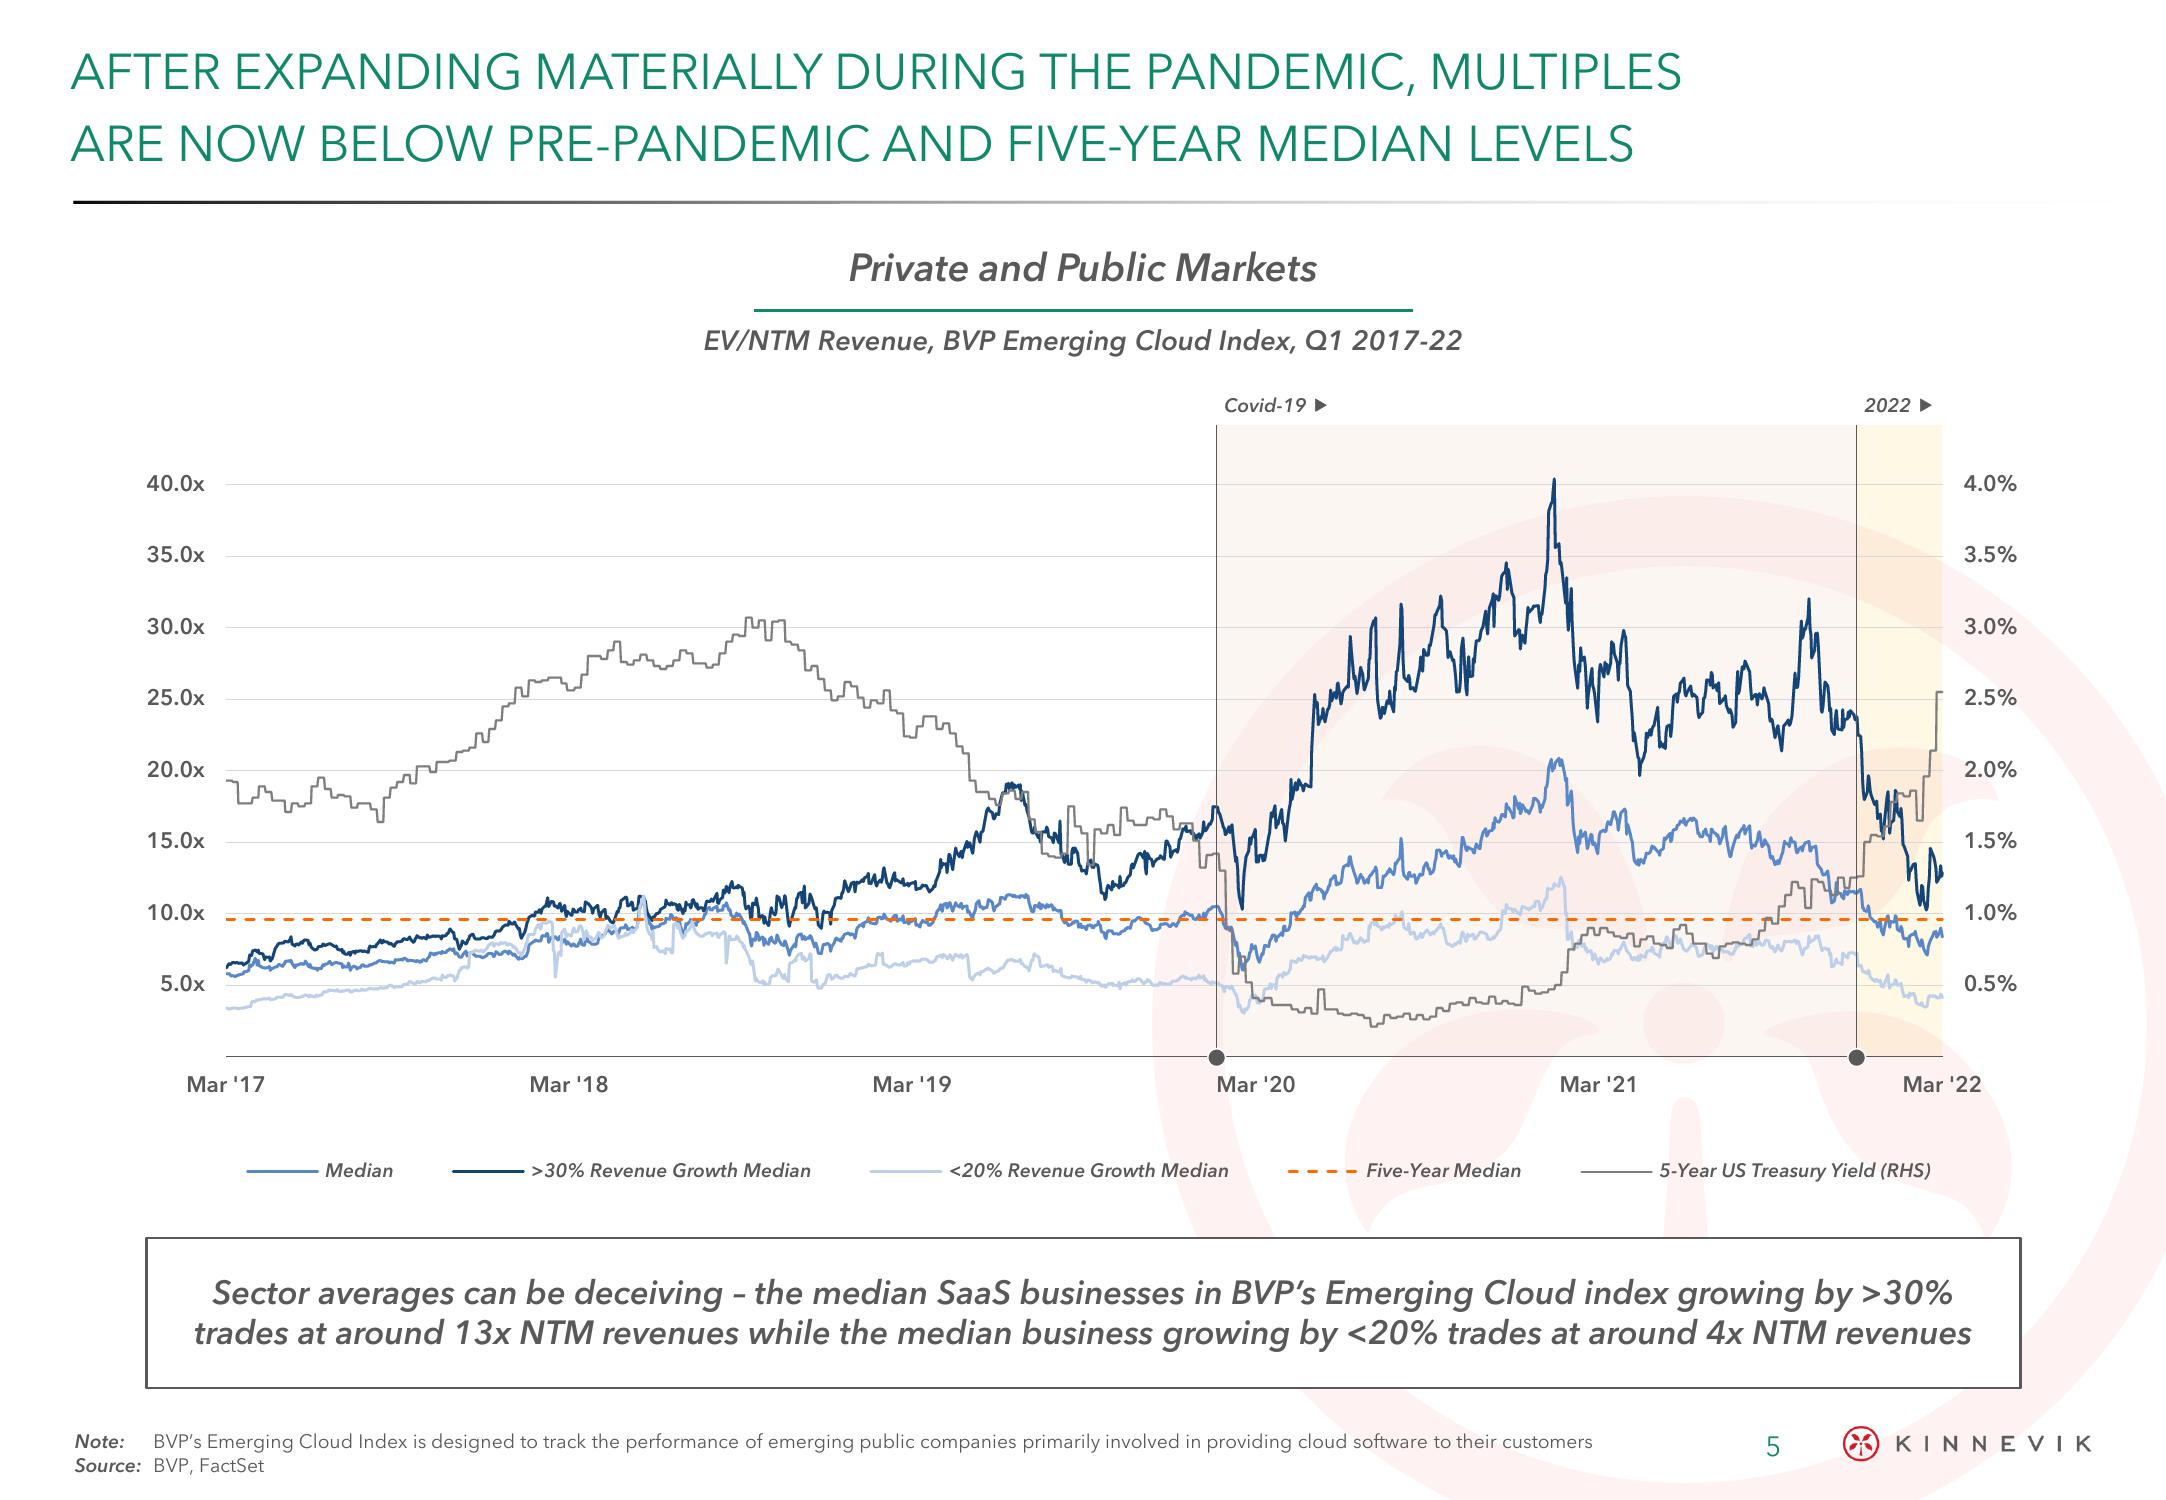
AFTER EXPANDING MATERIALLY DURING THE PANDEMIC, MULTIPLES
ARE NOW BELOW PRE-PANDEMIC AND FIVE-YEAR MEDIAN LEVELS
40.0x
35.0x
30.0x
25.0x
20.0x
15.0x
10.0x
5.0x
Mar '17
Median
Mar '18
Private and Public Markets
EV/NTM Revenue, BVP Emerging Cloud Index, Q1 2017-22
>30% Revenue Growth Median
Mar ¹19
Covid-19
willen
Мновитимим
me miser
rechen.
Mar ¹20
<20% Revenue Growth Median
may
- Five-Year Median
Mar ¹21
тими
Note: BVP's Emerging Cloud Index is designed to track the performance of emerging public companies primarily involved in providing cloud software to their customers
Source: BVP, FactSet
2022 ►
5-Year US Treasury Yield (RHS)
5
4.0%
3.5%
3.0%
2.5%
2.0%
1.5%
1.0%
0.5%
Mar '22
Sector averages can be deceiving - the median SaaS businesses in BVP's Emerging Cloud index growing by >30%
trades at around 13x NTM revenues while the median business growing by <20% trades at around 4x NTM revenues
KINNEVIKView entire presentation