Oatly Results Presentation Deck
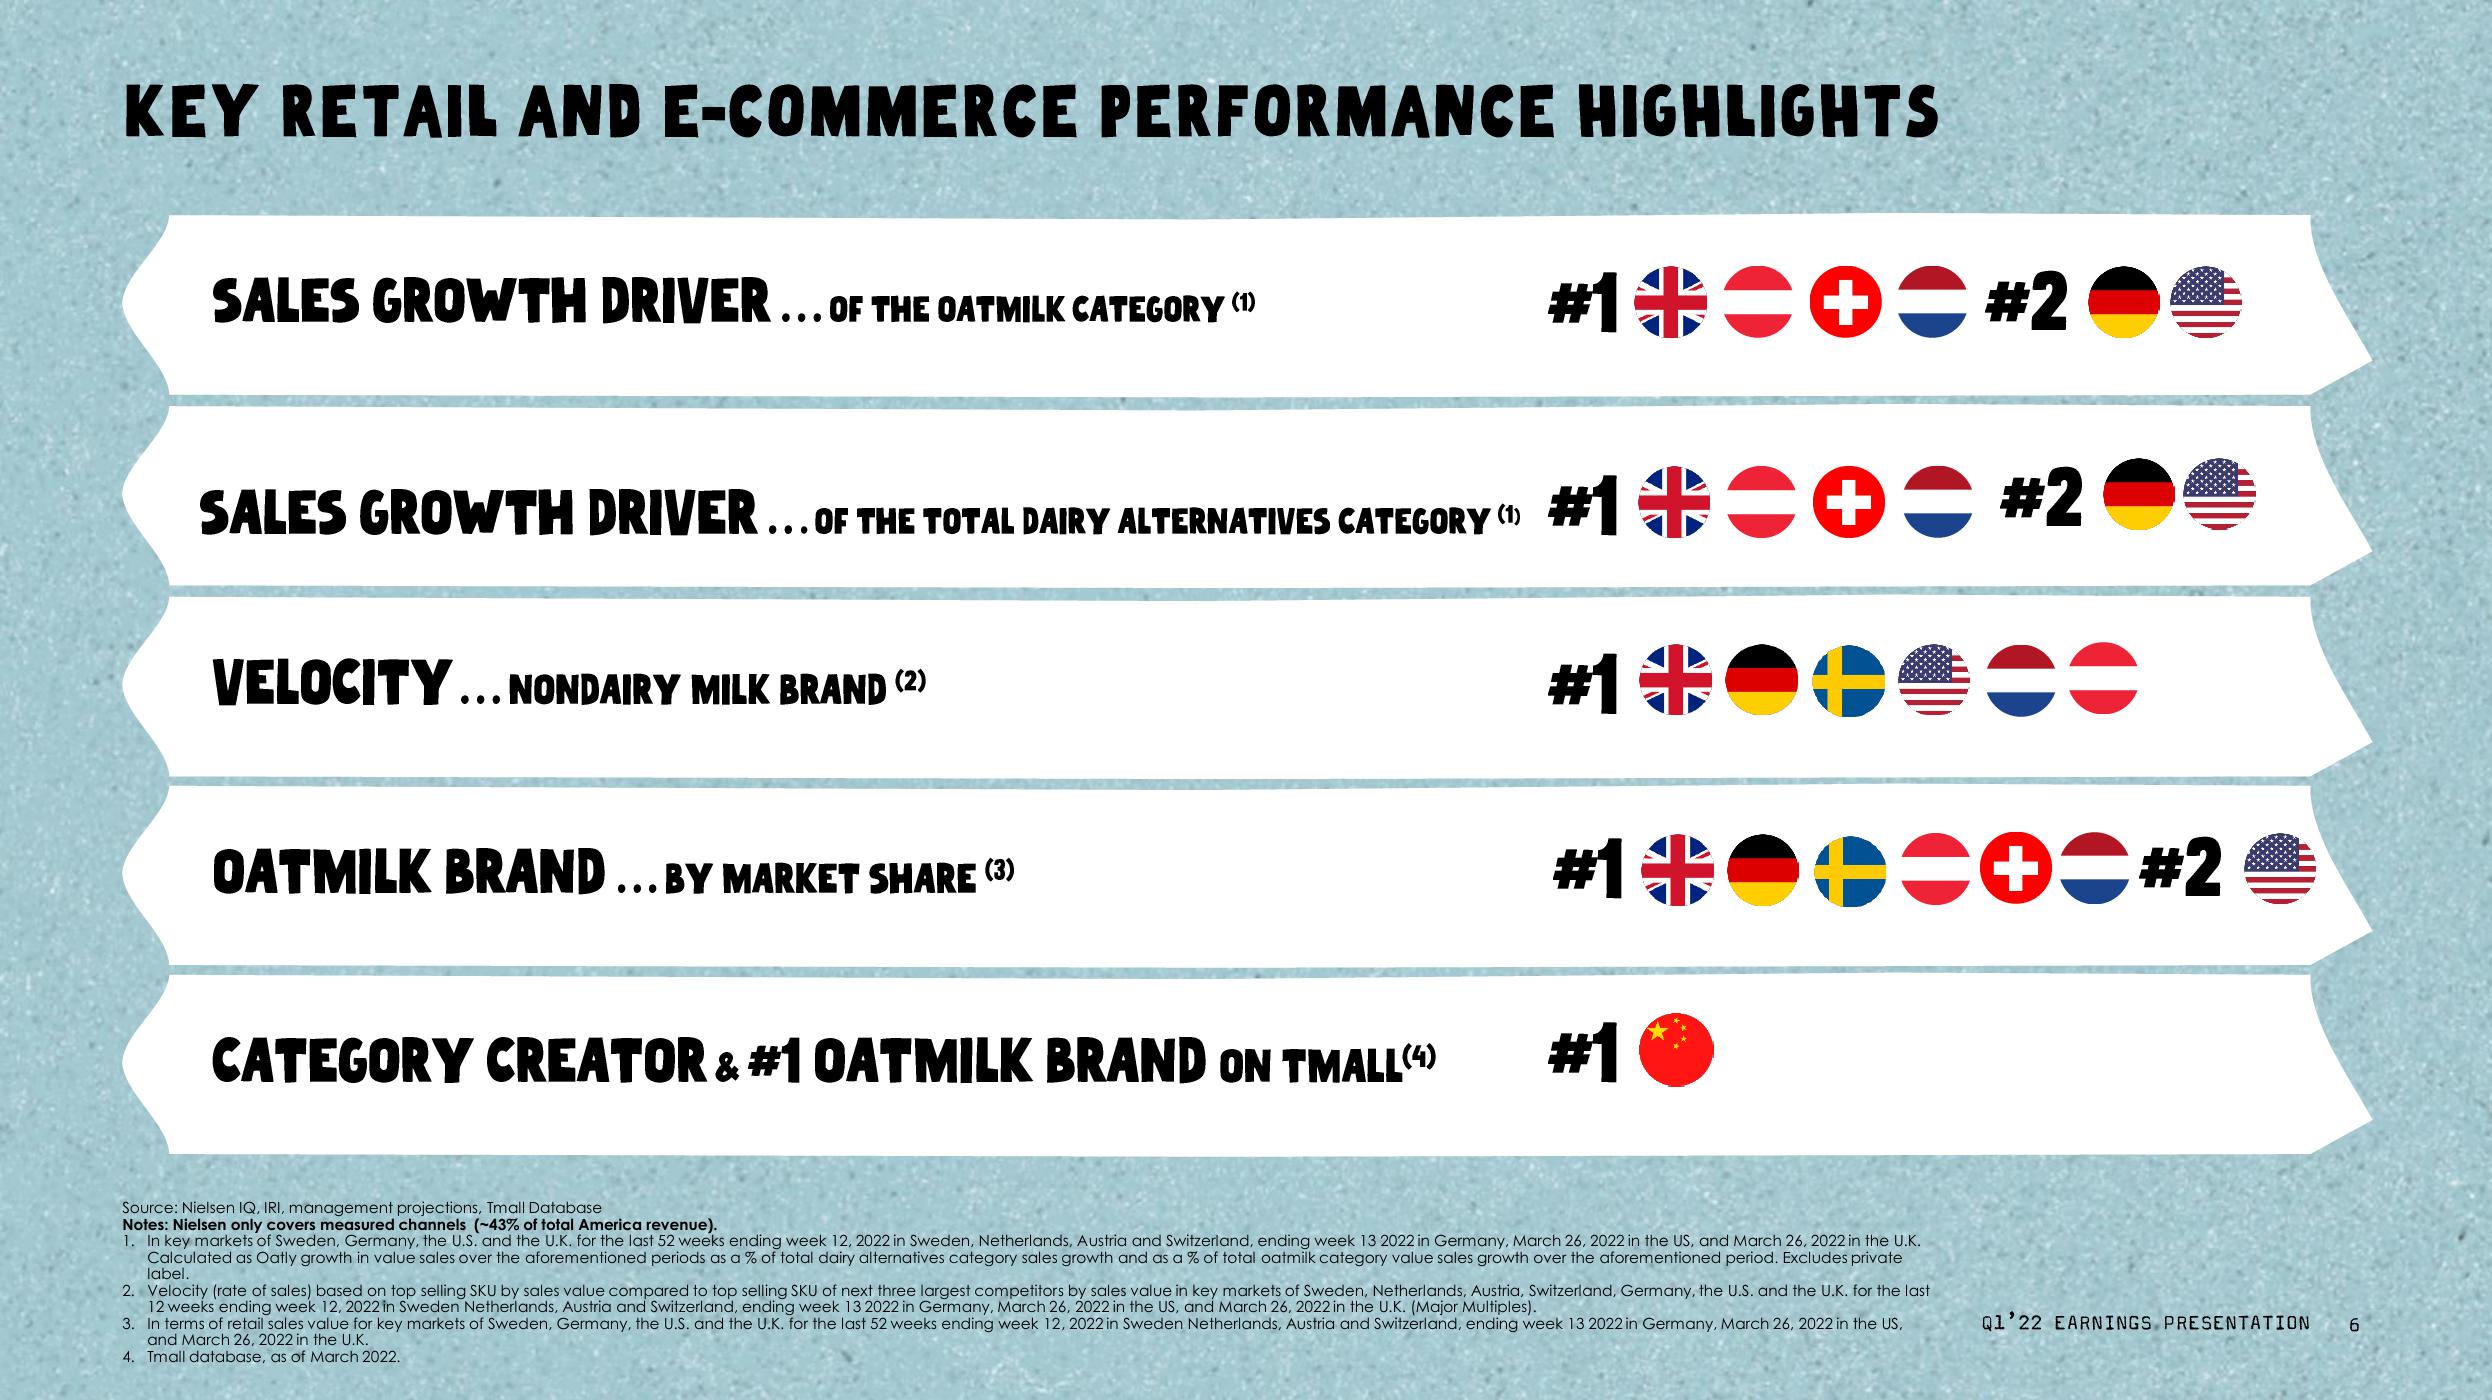
KEY RETAIL AND E-COMMERCE PERFORMANCE HIGHLIGHTS
SALES GROWTH DRIVER... OF THE OATMILK CATEGORY (1)
SALES GROWTH DRIVER... OF THE TOTAL DAIRY ALTERNATIVES CATEGORY #1
(1)
VELOCITY... NONDAIRY MILK BRAND (2)
OATMILK BRAND... BY MARKET SHARE (3)
#1半=+= #2
#1 == #2
CATEGORY CREATOR & #1 OATMILK BRAND ON TMALL(4)
#1米
#1*=*=#2
#1米
Source: Nielsen IQ, IRI, management projections, Tmall Database
Notes: Nielsen only covers measured channels (-43% of total America revenue).
1. In key markets of Sweden, Germany, the U.S. and the U.K. for the last 52 weeks ending week 12, 2022 in Sweden, Netherlands, Austria and Switzerland, ending week 13 2022 in Germany, March 26, 2022 in the US, and March 26, 2022 in the U.K.
Calculated as Oatly growth in value sales over the aforementioned periods as a % of total dairy alternatives category sales growth and as a % of total oatmilk category value sales growth over the aforementioned period. Excludes private
label.
2. Velocity (rate of sales) based on top selling SKU by sales value compared to top selling SKU of next three largest competitors by sales value in key markets of Sweden, Netherlands, Austria, Switzerland, Germany, the U.S. and the U.K. for the last
12 weeks ending week 12, 2022 in Sweden Netherlands, Austria and Switzerland, ending week 13 2022 in Germany, March 26, 2022 in the US, and March 26, 2022 in the U.K. (Major Multiples).
3. In terms of retail sales value for key markets of Sweden, Germany, the U.S. and the U.K. for the last 52 weeks ending week 12, 2022 in Sweden Netherlands, Austria and Switzerland, ending week 13 2022 in Germany, March 26, 2022 in the US,
and March 26, 2022 in the U.K.
4. Tmall database, as of March 2022.
Q1'22 EARNINGS PRESENTATION 6View entire presentation