Frontier IPO Presentation Deck
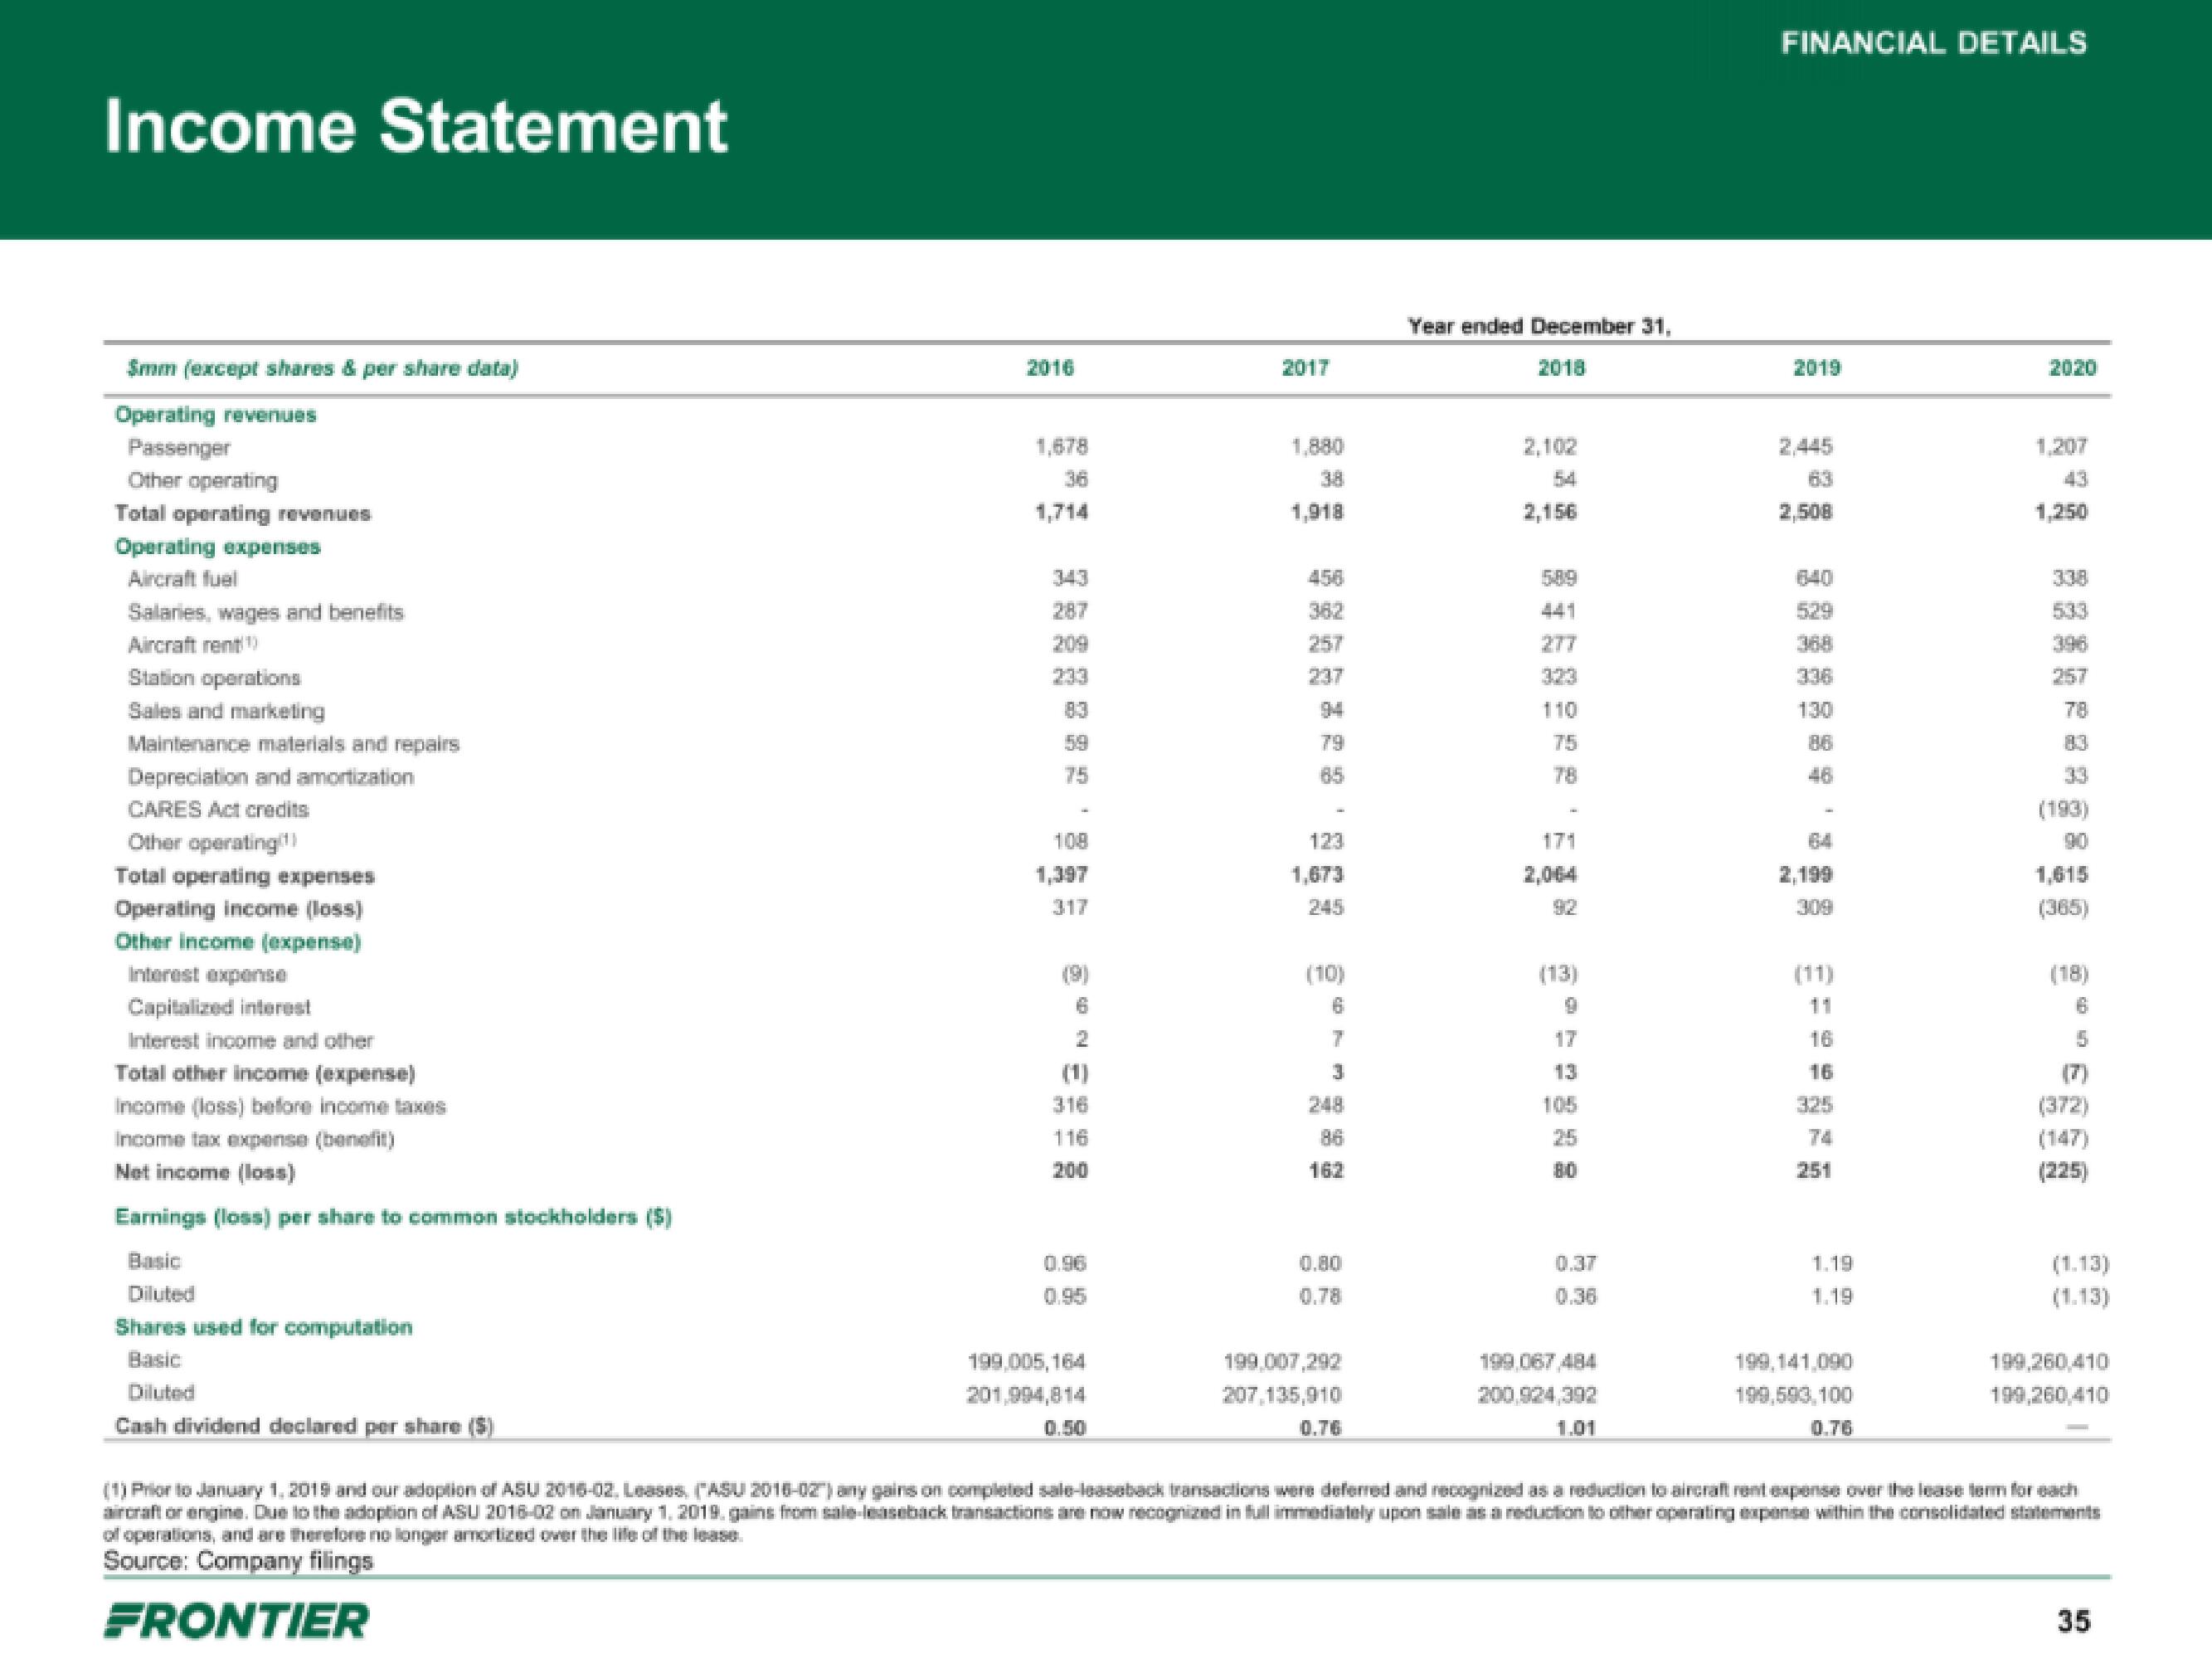
Income Statement
Smm (except shares & per share data)
Operating revenues
Passenger
Other operating
Total operating revenues
Operating expenses
Aircraft fuel
Salaries, wages and benefits
Aircraft rent! ¹
Station operations
Sales and marketing
Maintenance materials and repairs
Depreciation and amortization
CARES Act credits
Other operating¹
Total operating expenses
Operating income (loss)
Other income (expense)
Interest expense
Capitalized interest
Interest income and other
Total other income (expense)
Income (loss) before income taxes
Income tax expense (benefit)
Net income (loss)
Earnings (loss) per share to common stockholders ($)
Basic
Diluted
Shares used for computation
Basic
Diluted
Cash dividend declared per share
2016
1,714
287
209
5:9
75
1,397
317
2
316
116
200
0.96
199,005,164
201,994,814
1,880
3.8
1,918
257
237
85
123
1,673
(10)
6
7
162
0.80
199,007,292
207,135,910
0.76
Year ended December 31,
2018
2,102
54
2,156
441
110
75
78
171
2,064
(13)
9
105
80
0.37
199,067,484
200,924,392
1.01
FINANCIAL DETAILS
2019
2,508
5:29
130
46
(11)
16
16
251
1.19
1.19
199,141,090
199,593,100
0.76
2020
1,250
257
(193)
1,615
(365)
(18)
16
5
(372)
(1.13)
(1.13)
199,260,410
199,260,410
(1) Prior to January 1, 2019 and our adoption of ASU 2016-02, Leases, (ASU 2016-02") any gains on completed sale-leaseback transactions were deferred and recognized as a reduction to aircraft rent expense over the lease term for each
aircraft or engine. Due to the adoption of ASU 2016-02 on January 1, 2019. gains from sale-leaseback transactions are now recognized in full immediately upon sale as a reduction to other operating expense within the consolidated statements
of operations, and are therefore no longer amortized over the life of the lease.
Source: Company filings
FRONTIER
35View entire presentation