Altus Power SPAC Presentation Deck
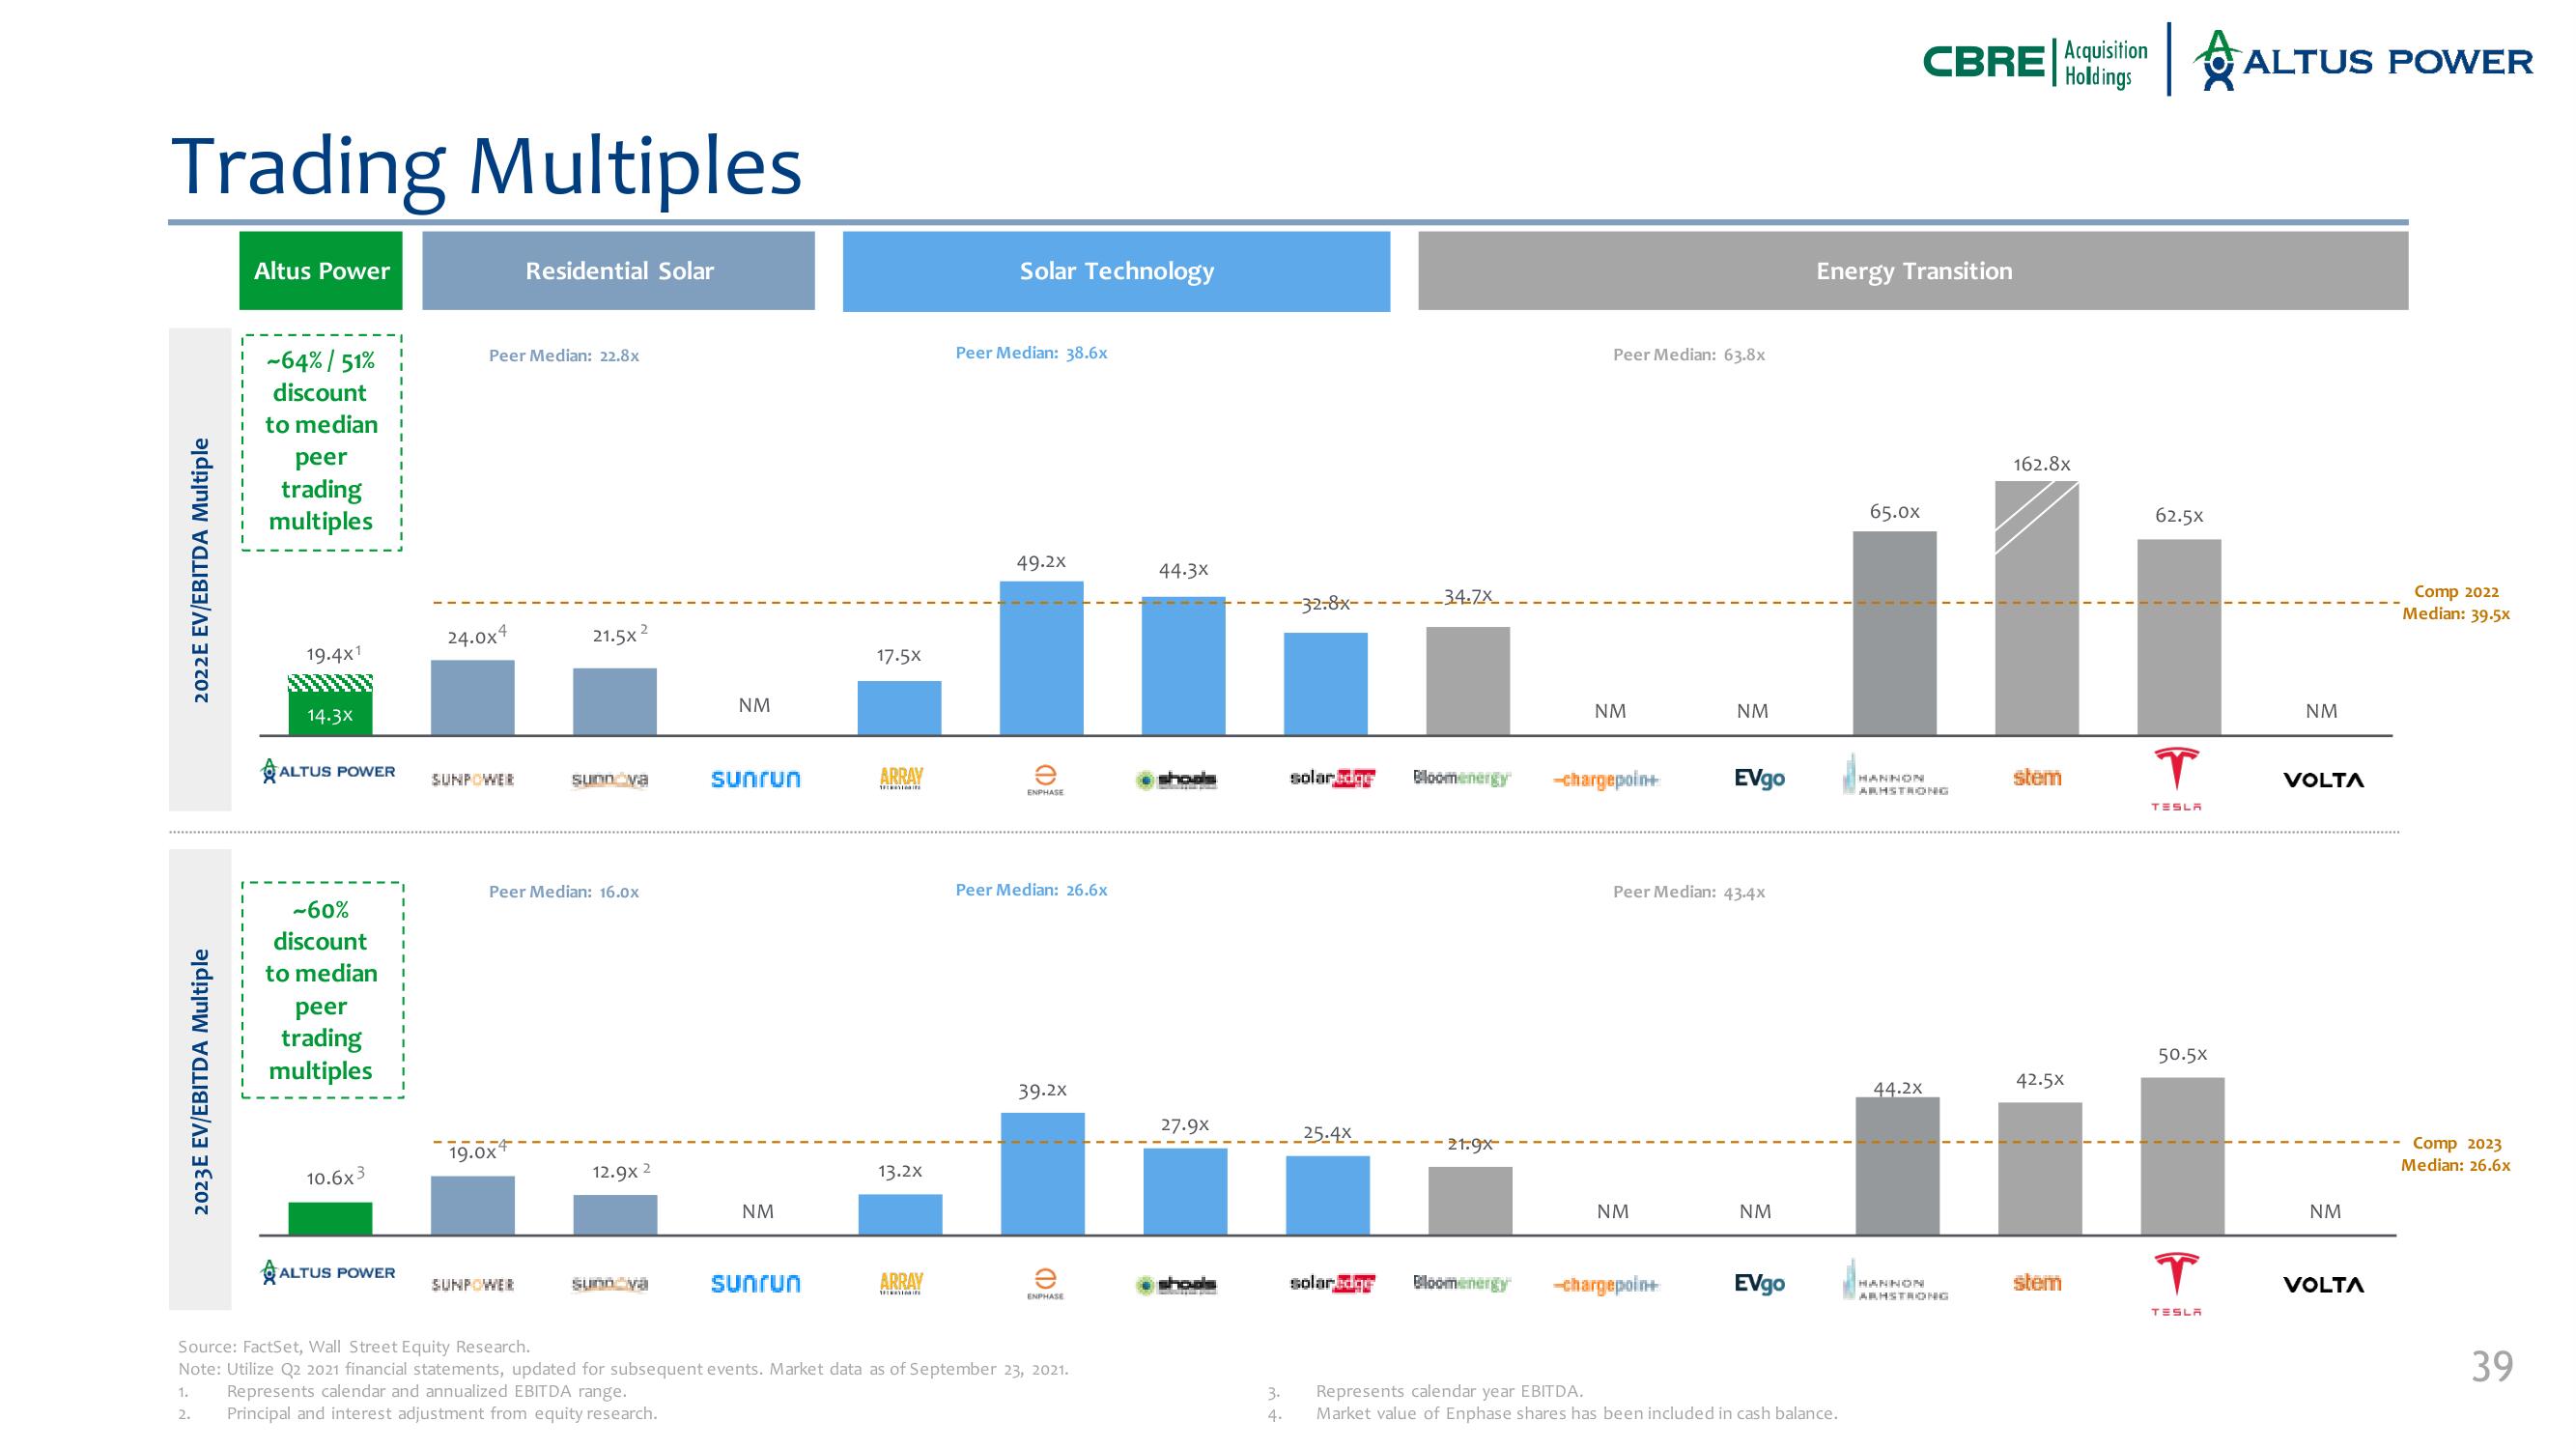
Trading Multiples
2022E EV/EBITDA Multiple
2023E EV/EBITDA Multiple
Altus Power
1.
2.
-64% / 51%
discount
to median
peer
trading
multiples
19.4x1
14.3x
ALTUS POWER
-60%
discount
to median
peer
trading
multiples
10.6x3
ALTUS POWER
Peer Median: 22.8x
24.0x4
SUNPOWER
Residential Solar
19.0x
SUNPOWER
21.5x2
Peer Median: 16.0x
sunn va
12.9x 2
sunn va
NM
sunrun
NM
sunrun
17.5X
ARRAY
13.2x
ARRAY
Solar Technology
Peer Median: 38.6x
49.2x
ENPHASE
Peer Median: 26.6x
39.2x
ENPHASE
Source: FactSet, Wall Street Equity Research.
Note: Utilize Q2 2021 financial statements, updated for subsequent events. Market data as of September 23, 2021.
Represents calendar and annualized EBITDA range.
Principal and interest adjustment from equity research.
44.3x
27.9X
shouls
3.
4.
-32.8x-
-34.7x
solaredge Bloomenergy
25.4x
21:9x
solaredge Bloomenergy
Peer Median: 63.8x
NM
-chargepoint
NM
NM
Peer Median: 43.4x
-chargepoin+
EVgo
NM
EVgo
Energy Transition
Represents calendar year EBITDA.
Market value of Enphase shares has been included in cash balance.
CBRE Acquisition
Holdings
65.0x
HANNON
ARMSTRONG
44.2x
HANNON
ARHSTRONG
162.8x
stem
42.5X
stem
62.5×
T
TESLA
50.5×
T
TESLA
A
ALTUS POWER
NM
VOLTA
NM
VOLTA
Comp 2022
Median: 39.5x
Comp 2023
Median: 26.6x
39View entire presentation