Marti Results Presentation Deck
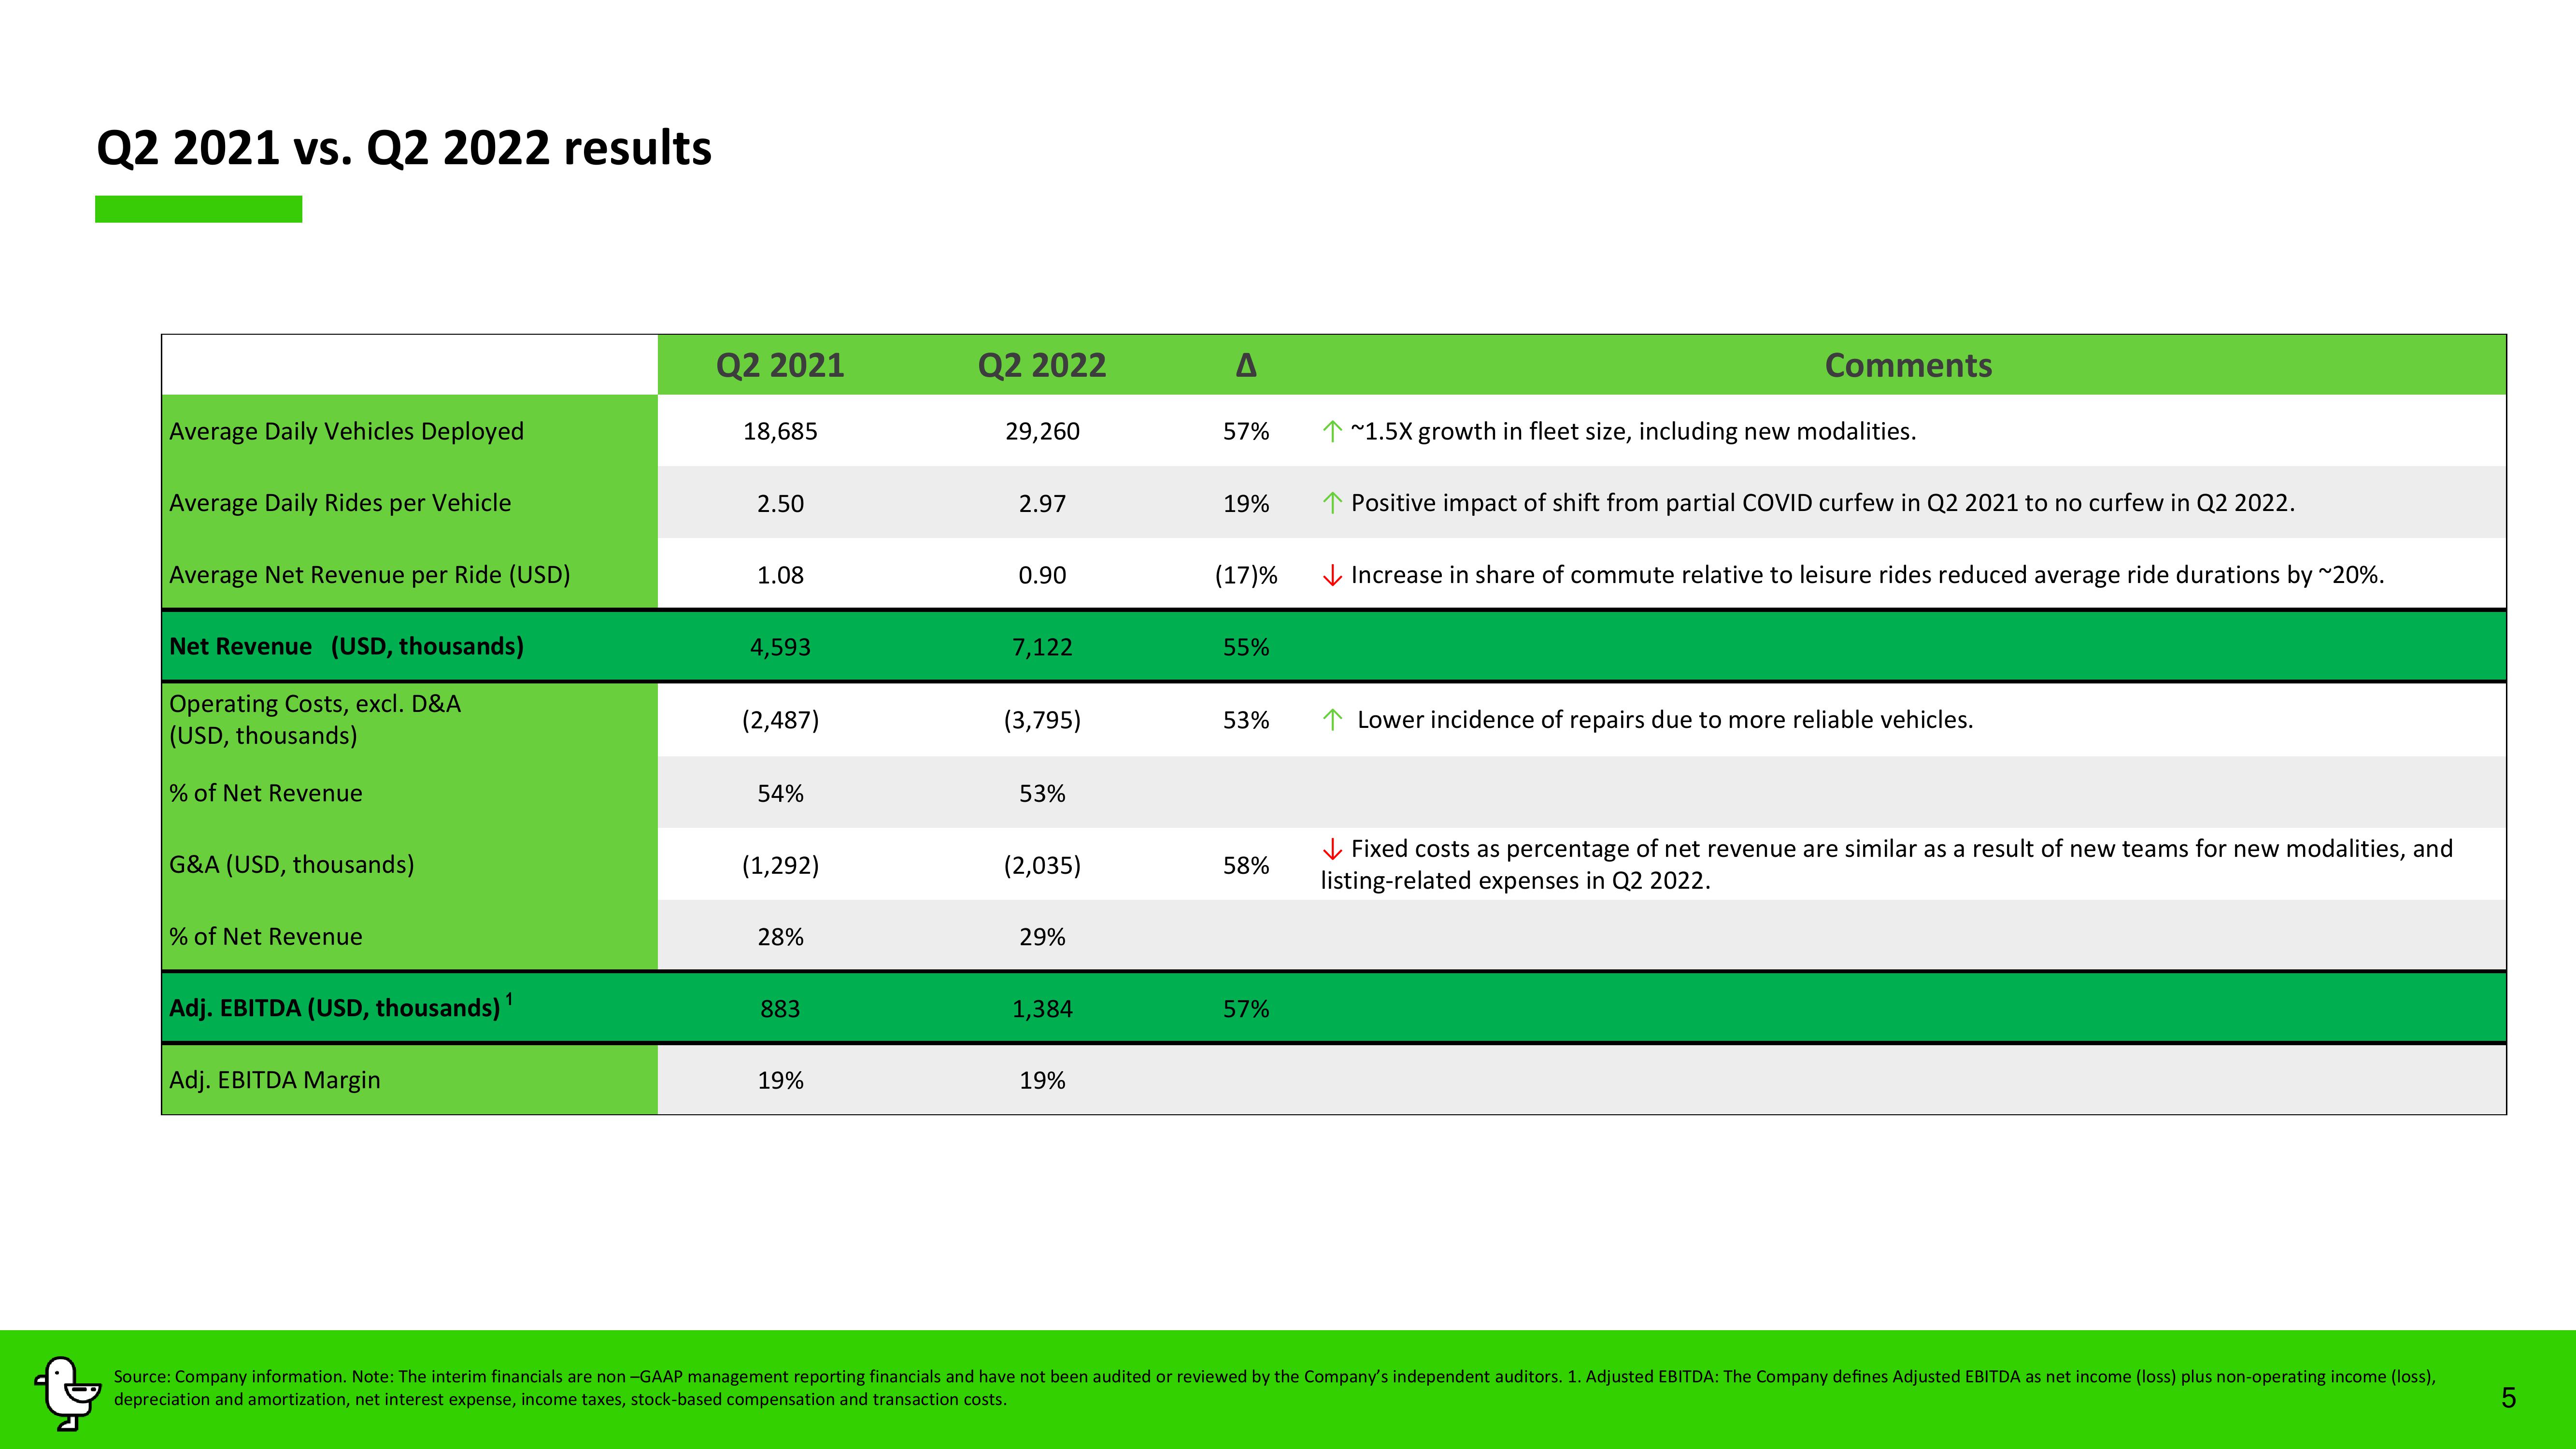
Q2 2021 vs. Q2 2022 results
Average Daily Vehicles Deployed
Average Daily Rides per Vehicle
Average Net Revenue per Ride (USD)
Net Revenue (USD, thousands)
Operating Costs, excl. D&A
(USD, thousands)
% of Net Revenue
G&A (USD, thousands)
% of Net Revenue
Adj. EBITDA (USD, thousands)
Adj. EBITDA Margin
1
Q2 2021
18,685
2.50
1.08
4,593
(2,487)
54%
(1,292)
28%
883
19%
Q2 2022
29,260
2.97
0.90
7,122
(3,795)
53%
(2,035)
29%
1,384
19%
A
57% ↑~1.5X growth in fleet size, including new modalities.
19%
(17)%
55%
53%
58%
Comments
57%
↑ Positive impact of shift from partial COVID curfew in Q2 2021 to no curfew in Q2 2022.
Increase in share of commute relative to leisure rides reduced average ride durations by ~20%.
↑ Lower incidence of repairs due to more reliable vehicles.
Fixed costs as percentage of net revenue are similar as a result of new teams for new modalities, and
listing-related expenses in Q2 2022.
Source: Company information. Note: The interim financials are non-GAAP management reporting financials and have not been audited or reviewed by the Company's independent auditors. 1. Adjusted EBITDA: The Company defines Adjusted EBITDA as net income (loss) plus non-operating income (loss),
depreciation and amortization, net interest expense, income taxes, stock-based compensation and transaction costs.
5View entire presentation