Getty SPAC Presentation Deck
Summary Financial Overview (Cont'd)
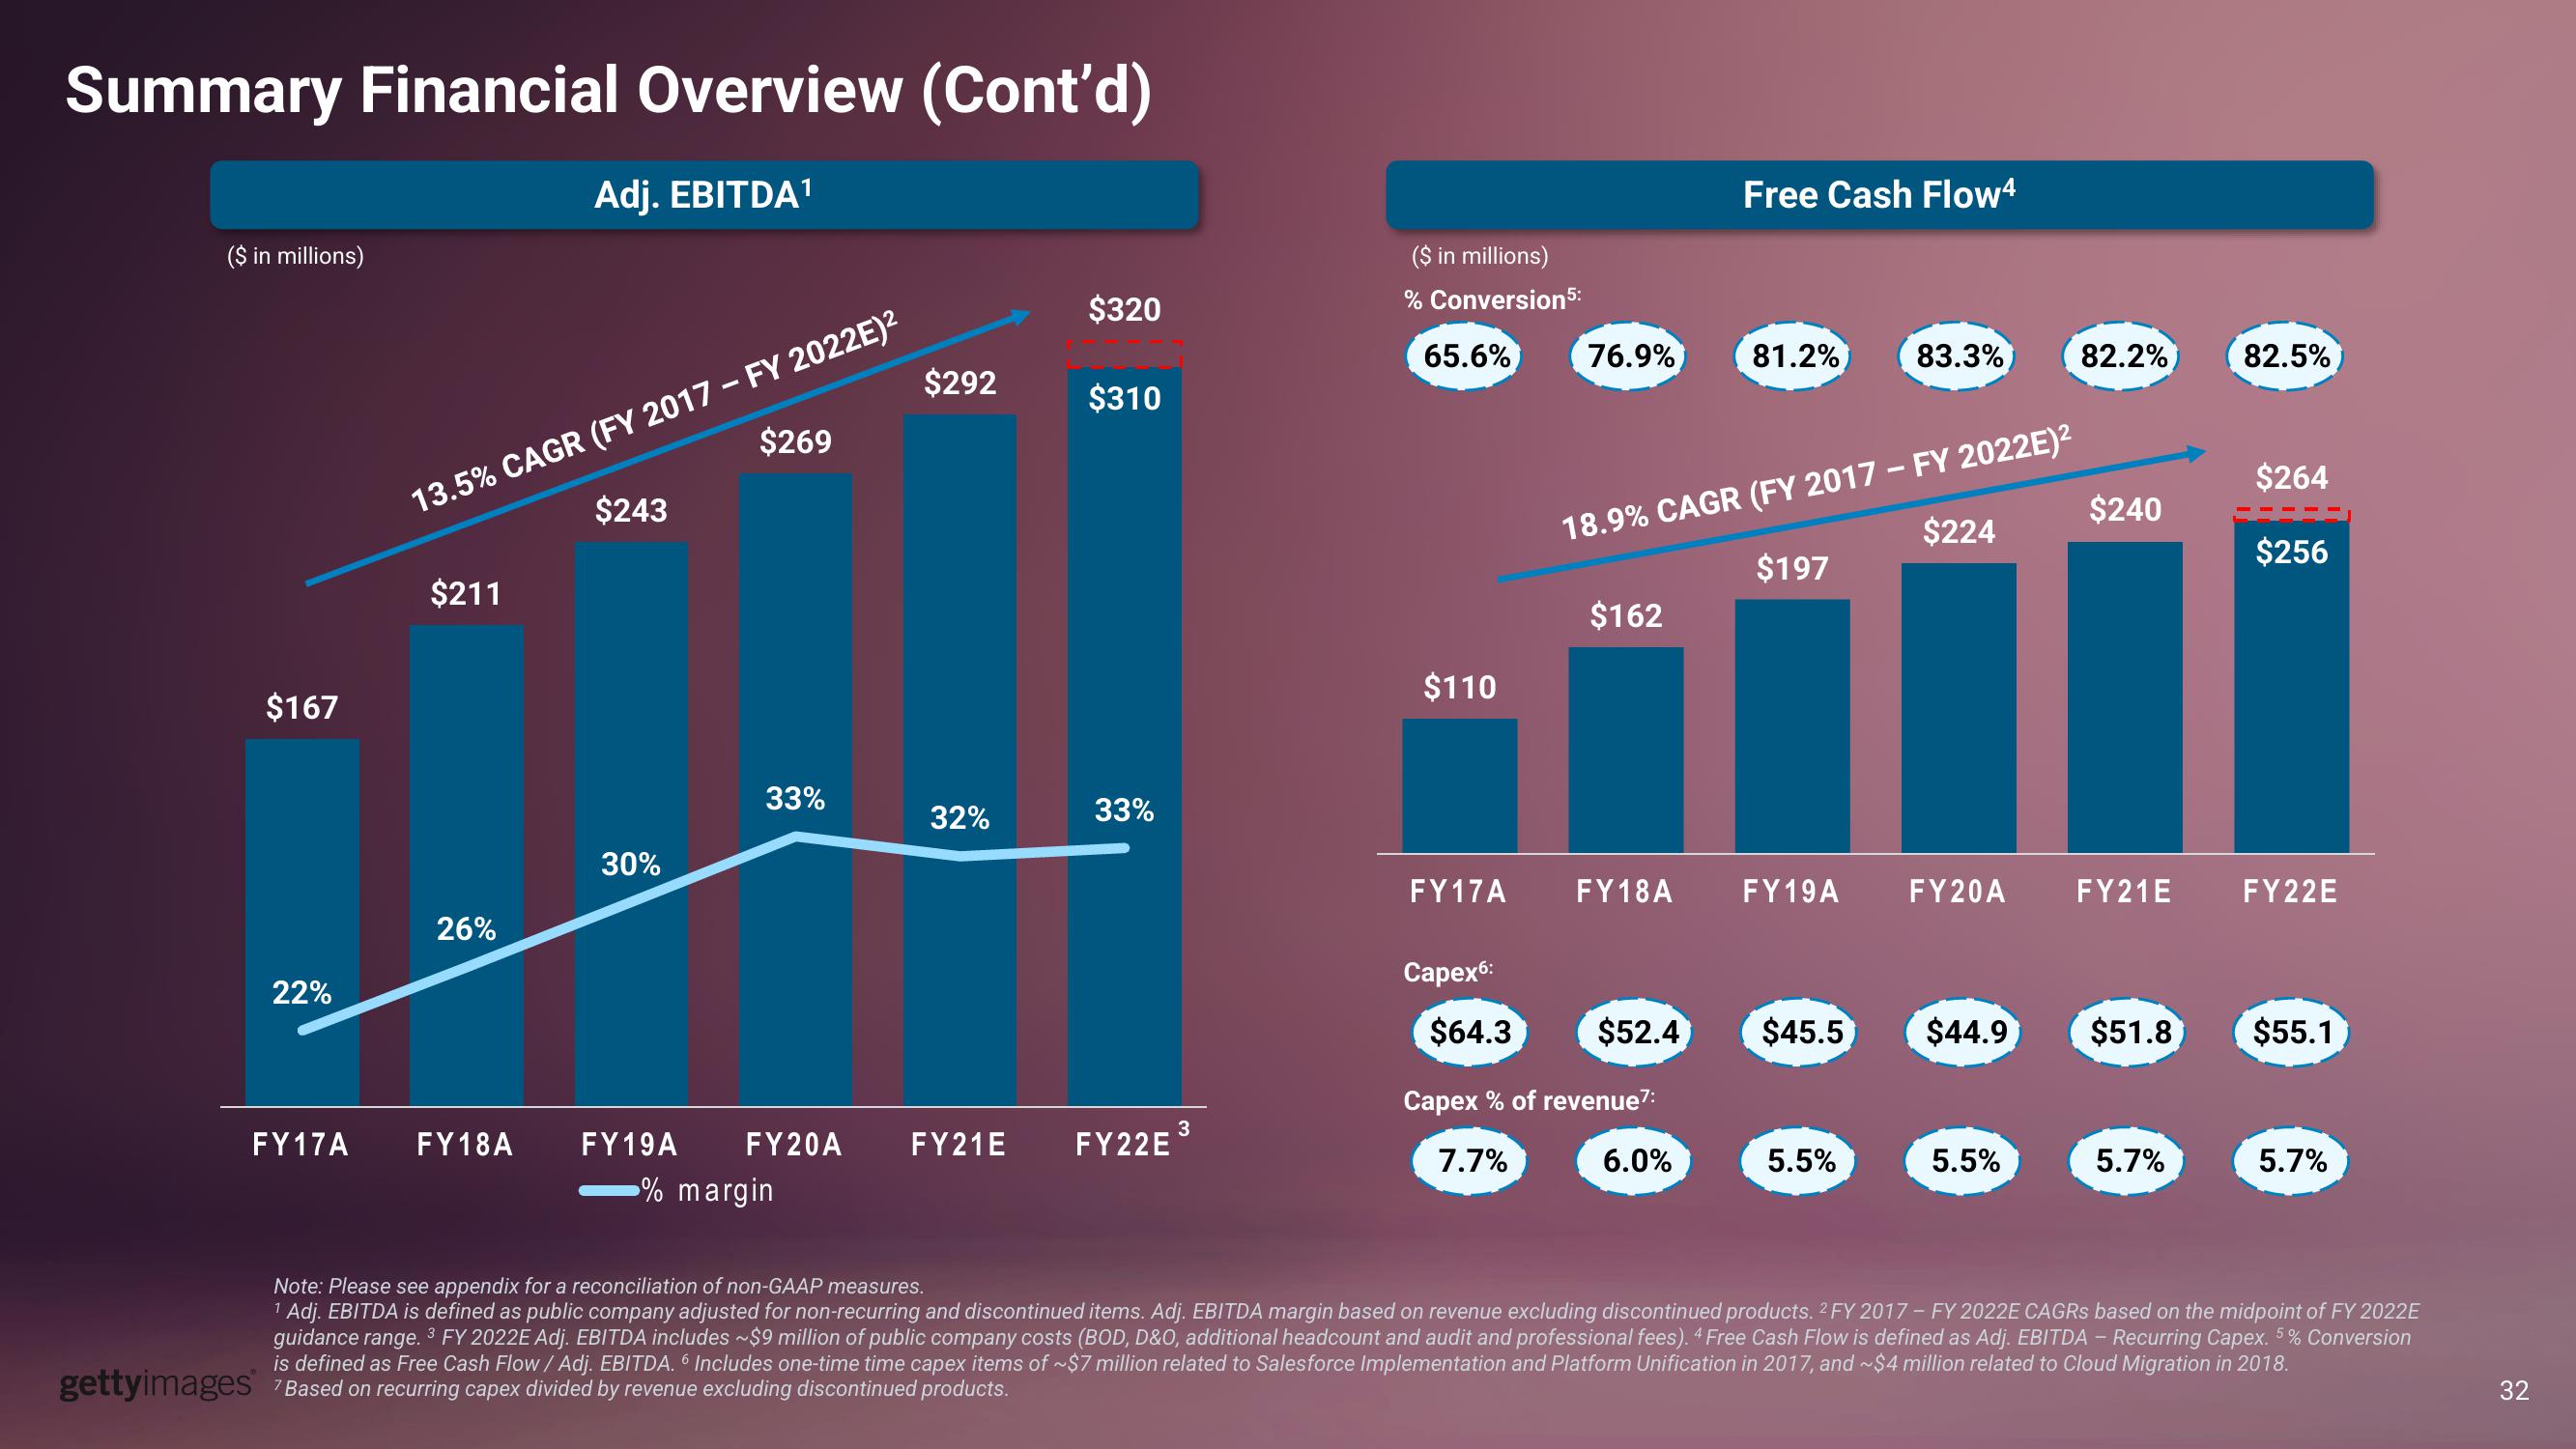
Adj. EBITDA¹
($ in millions)
$167
22%
13.5% CAGR (FY 2017 - FY 2022E)²
$269
$243
$211
26%
FY17A FY18A
30%
33%
$292
32%
FY19A FY20A FY21E
% margin
$320
$310
33%
FY22E
3
($ in millions)
% Conversion 5:
65.6%
$110
FY17A
Capex6:
76.9%
$64.3
$162
FY18A
$52.4
Capex % of revenue7:
7.7%
18.9% CAGR (FY 2017 - FY 2022E)²
$224
$197
Free Cash Flow4
6.0%
81.2%
FY19A
$45.5
83.3%
5.5%
FY20 A
$44.9
5.5%
82.2%
$240
FY21E
$51.8
5.7%
82.5%
$264
$256
FY22E
$55.1
5.7%
Note: Please see appendix for a reconciliation of non-GAAP measures.
Adj. EBITDA is defined as public company adjusted for non-recurring and discontinued items. Adj. EBITDA margin based on revenue excluding discontinued products. 2 FY 2017 - FY 2022E CAGRS based on the midpoint of FY 2022E
guidance range. 3 FY 2022E Adj. EBITDA includes ~$9 million of public company costs (BOD, D&O, additional headcount and audit and professional fees). 4 Free Cash Flow is defined as Adj. EBITDA - Recurring Capex. 5% Conversion
is defined as Free Cash Flow / Adj. EBITDA. Includes one-time time capex items of ~$7 million related to Salesforce Implementation and Platform Unification in 2017, and ~$4 million related to Cloud Migration in 2018.
gettyimages Based on recurring capex divided by revenue excluding discontinued products.
7
32View entire presentation