GlobalFoundries Results Presentation Deck slide image

GlobalFoundries Results Presentation Deck

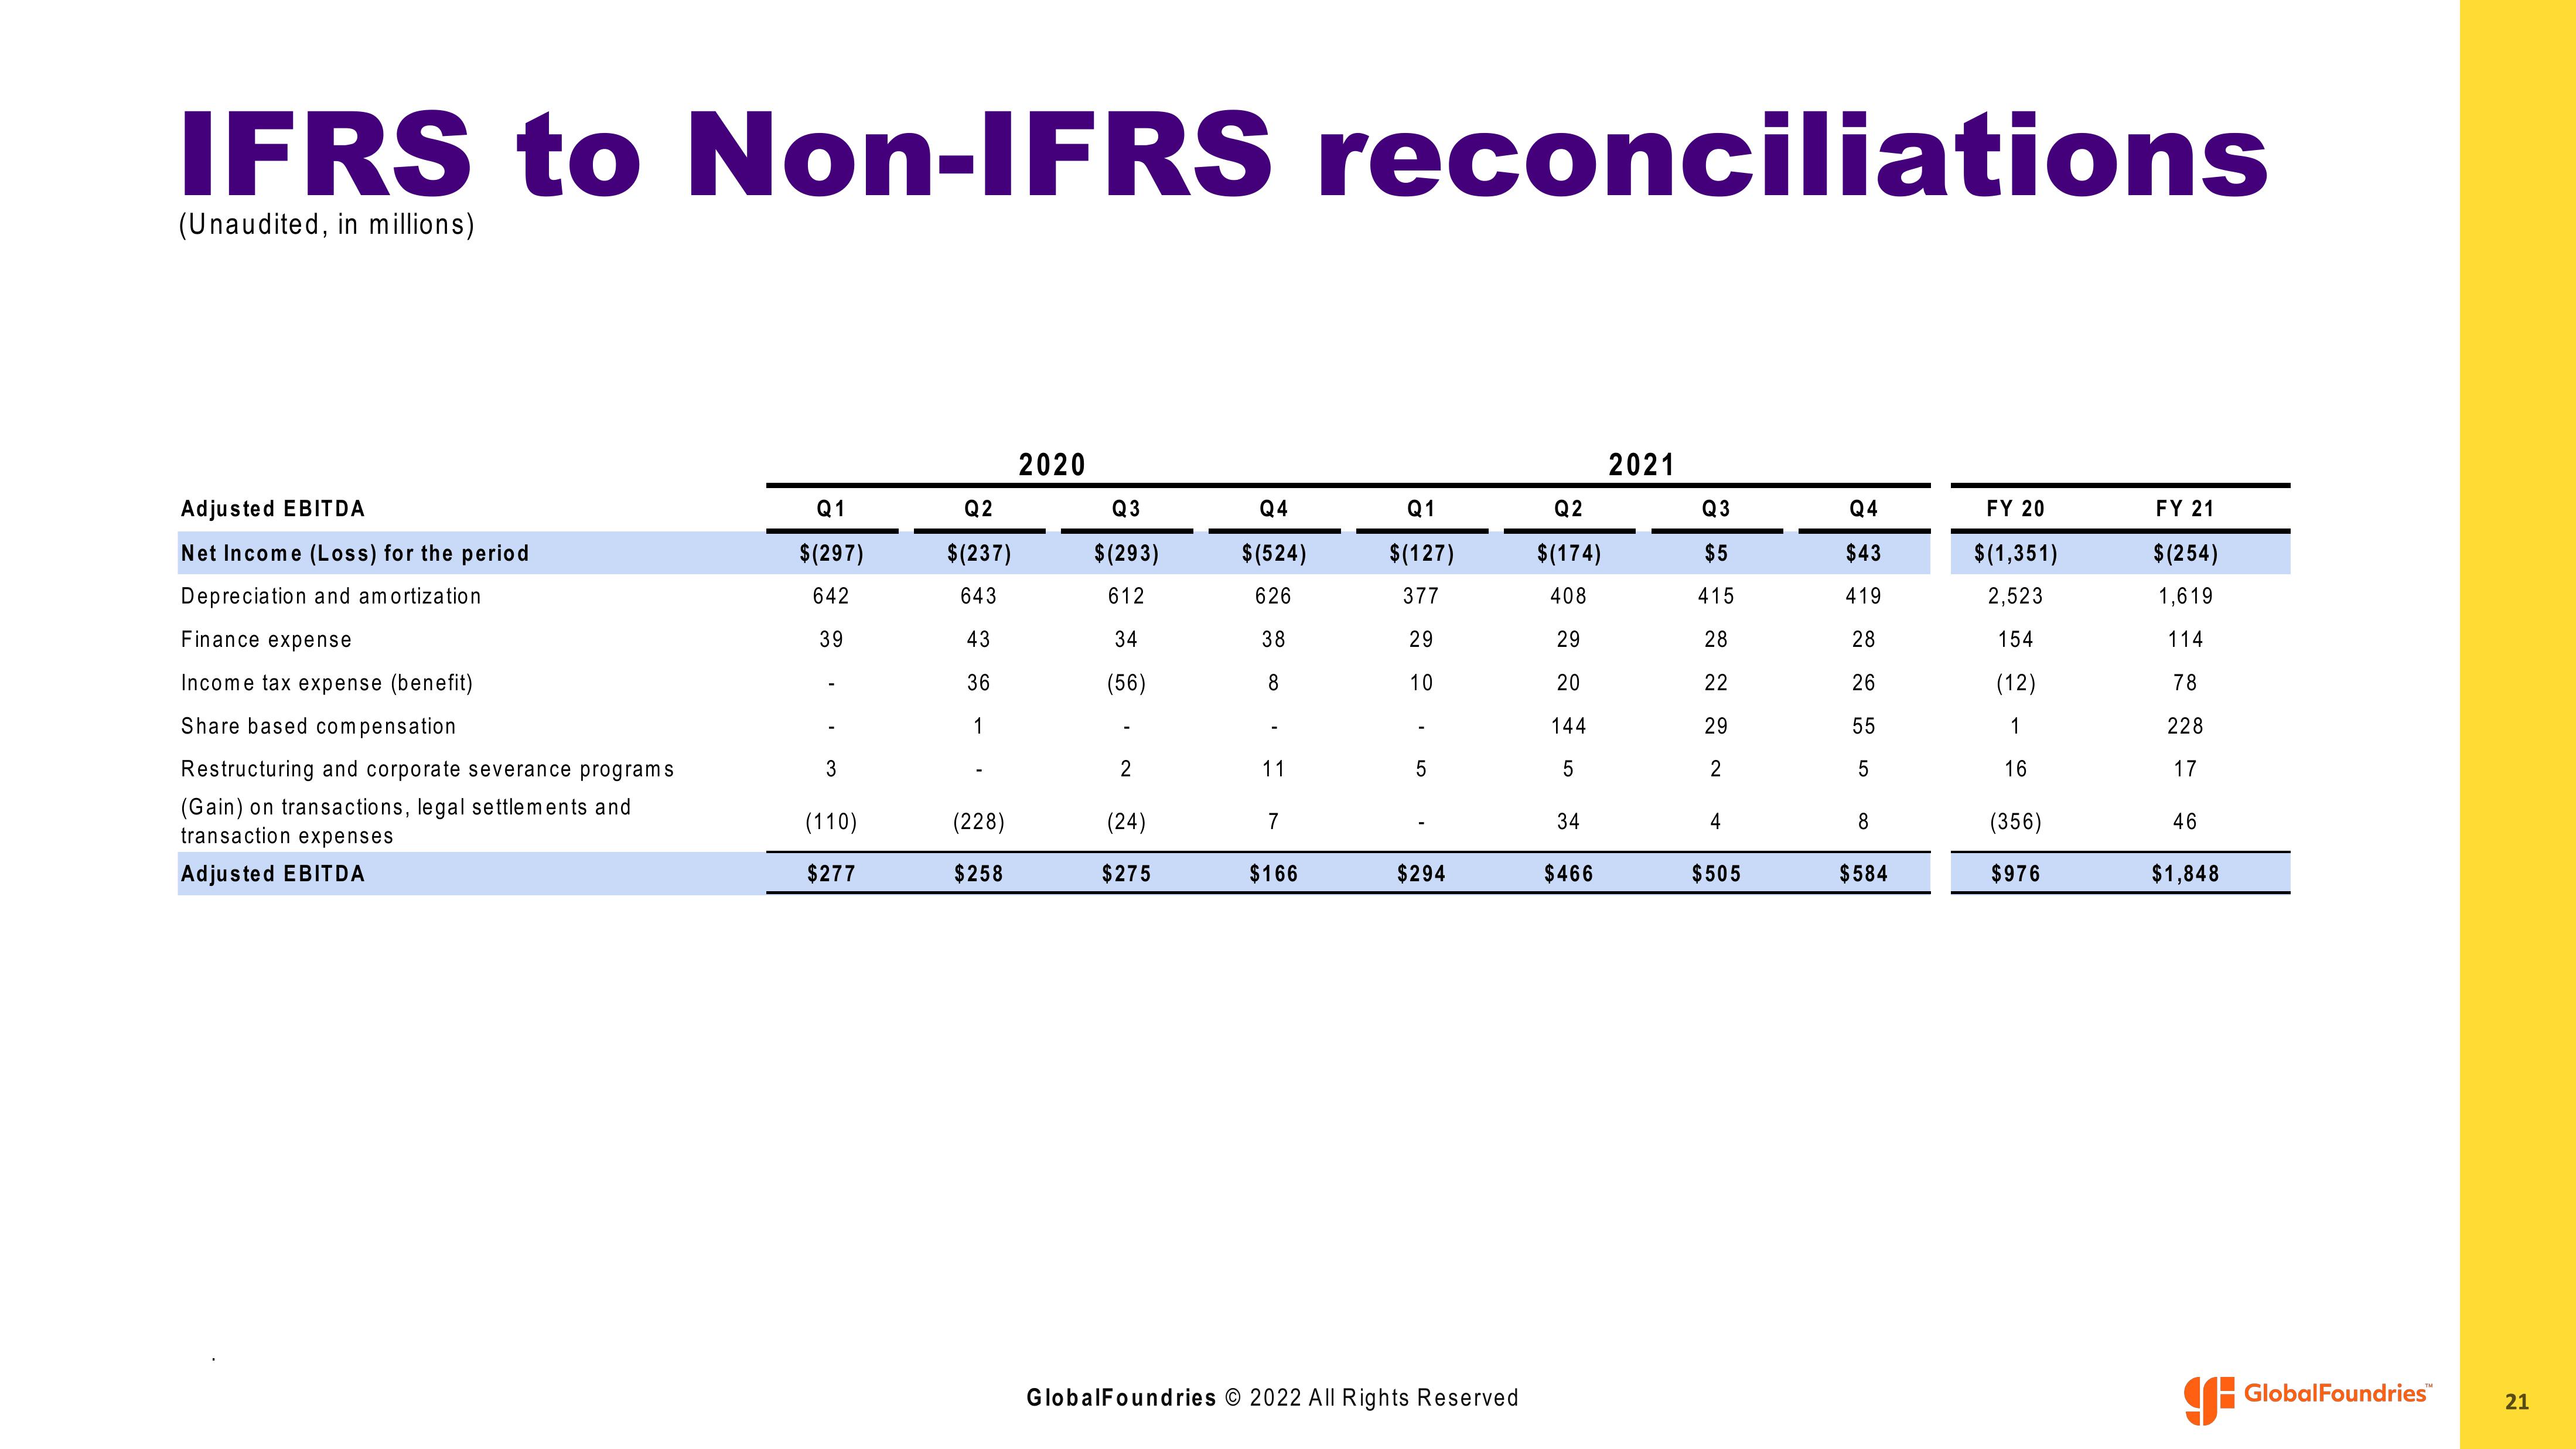
IFRS to Non-IFRS reconciliations (Unaudited, in millions) Adjusted EBITDA Net Income (Loss) for the period Depreciation and amortization Finance expense Income tax expense (benefit) Share based compensation Restructuring and corporate severance programs (Gain) on transactions, legal settlements and transaction expenses Adjusted EBITDA Q1 $(297) 39 3 (110) $277 Q2 $(237) 643 43 36 1 (228) $258 2020 Q3 $(293) 612 (56) 2 (24) $275 Q4 $(524) 626 38 8 11 7 $166 Q1 $(127) 377 29 10 5 $294 GlobalFoundries © 2022 All Rights Reserved Q2 $(174) 408 29 20 144 5 34 $466 2021 Q3 $5 415 28 22 29 2 4 $505 Q4 $43 419 28 26 55 5 8 $584 FY 20 $(1,351) 2,523 154 (12) 1 16 (356) $976 FY 21 $(254) 1,619 114 78 228 17 46 $1,848 GlobalFoundries 21
View entire presentation