Stem SPAC Presentation Deck
stem Valuation Benchmarking (cont'd)
Valuation benchmarking (cont'd)
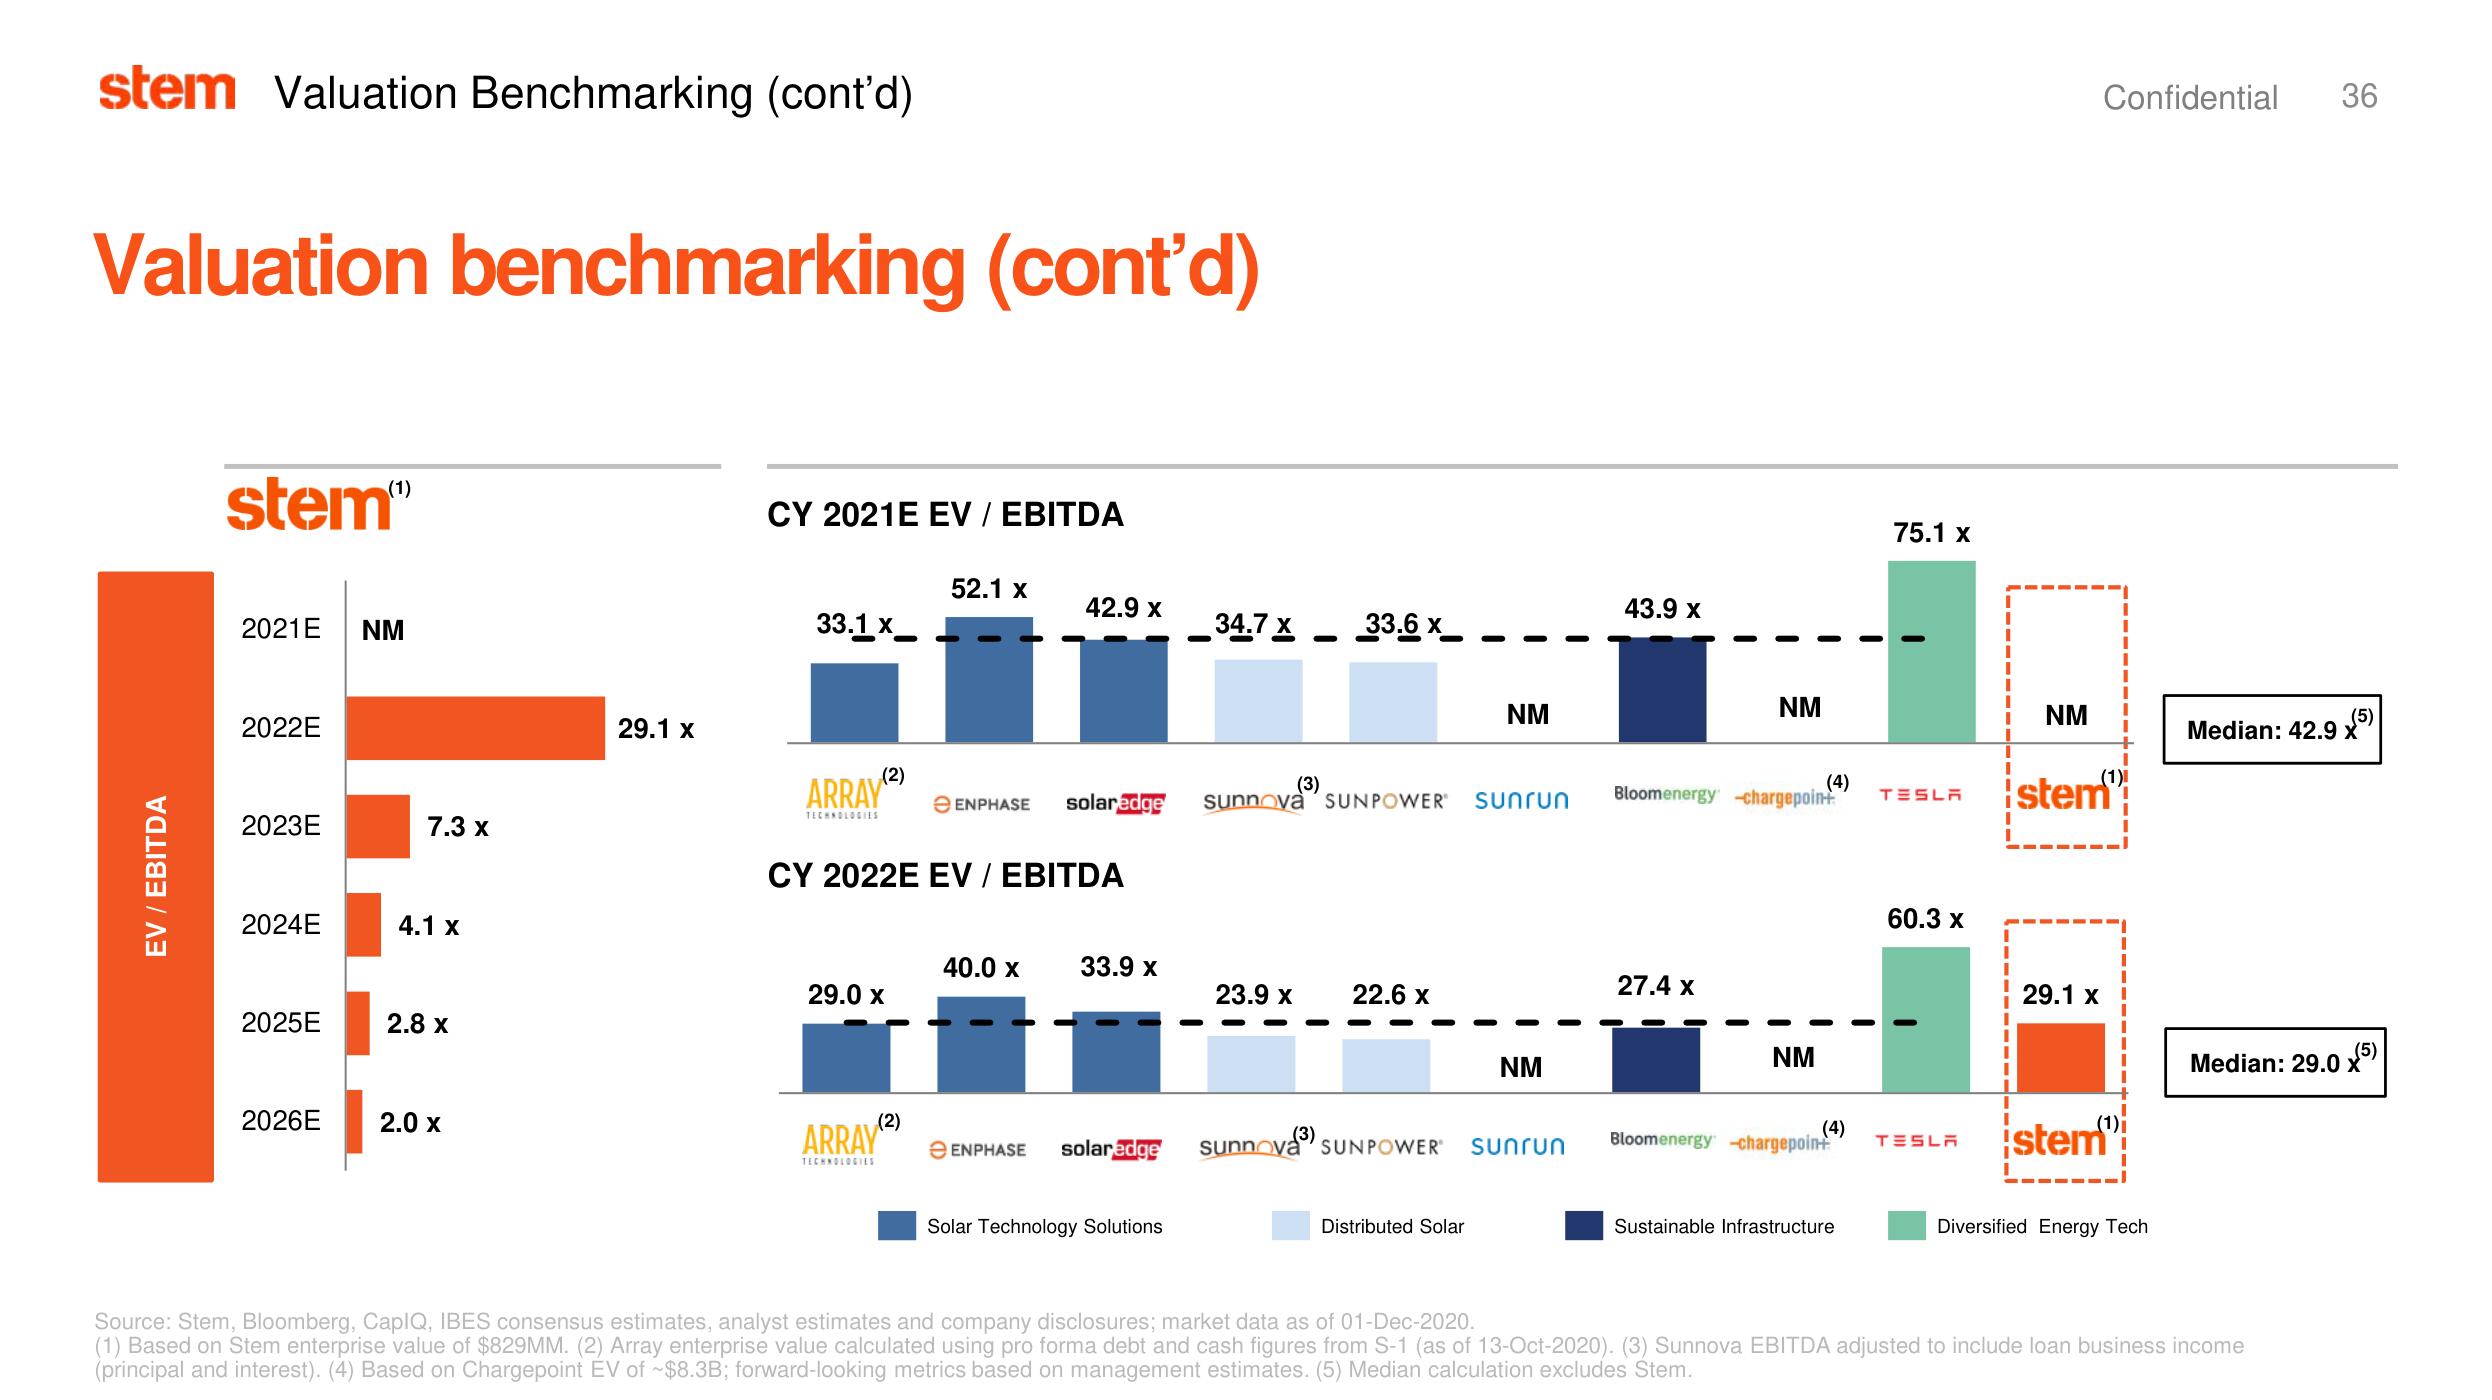
EV / EBITDA
stem"
2021E NM
2022E
2023E
2024E
2025E
2026E
7.3 x
4.1 x
2.8 x
2.0 x
29.1 x
CY 2021E EV / EBITDA
33.1 x
(2)
ARRAY
TECHNOLOGIES
29.0 x
(2)
52.1 x
ARRAY
TECHNOLOGIES
e ENPHASE
CY 2022E EV / EBITDA
40.0 X
42.9 x
e ENPHASE
solaredge
33.9 x
solaredge
Solar Technology Solutions
34.7 X
●
23.9 x
(3)
sunnova SUNPOWER
33.6 x
(3)
22.6 x
NM
Distributed Solar
sunrun
NM
sunnova SUNPOWER' sunrun
43.9 x
NM
27.4 x
Bloomenergy chargepoint
(4)
NM
(4)
Bloomenergy-chargepoint
Sustainable Infrastructure
75.1 x
TESLA
60.3 x
TESLA
NM
Confidential 36
stem
29.1 x
(1)
istem
Diversified Energy Tech
(5)
Median: 42.9 x
(5)
Median: 29.0 x
Source: Stem, Bloomberg, CapIQ, IBES consensus estimates, analyst estimates and company disclosures; market data as of 01-Dec-2020.
(1) Based on Stem enterprise value of $829MM. (2) Array enterprise value calculated using pro forma debt and cash figures from S-1 (as of 13-Oct-2020). (3) Sunnova EBITDA adjusted to include loan business income
(principal and interest). (4) Based on Chargepoint EV of ~$8.3B; forward-looking metrics based on management estimates. (5) Median calculation excludes Stem.View entire presentation