Nexters Results Presentation Deck
Key operating highlights
$m
Bookings
108
Q3 2022
347
9M 2022
7 Source:
(1)
(2)
-6%
-9%
102
Q3 2023
316
9M 2023
'000 users
Monthly Paying Users (1)
305
Q3 2022
341
9M 2022
+23%
+13%
375
Q3 2023
383
9M 2023
$/month
Average Bookings Per Paying User (2)
113
Q3 2022
108
9M 2022
-26%
-22%
84
Q3 2023
85
9M 2023
Company information
The Company defines Monthly Paying Users, or MPUS, as the number of individuals who made a purchase of a virtual item at least once on a particular platform in the 30-day period ending with the measurement date; Quarterly MPU is the average of MPUS for each
month for the respective quarter
The Company defines Average Bookings Per Paying User, or ABPPU, as its total Bookings attributable to in-game purchases in a given period, divided by the number of months in that period, divided by the average number of MPUS during the period
GDEU
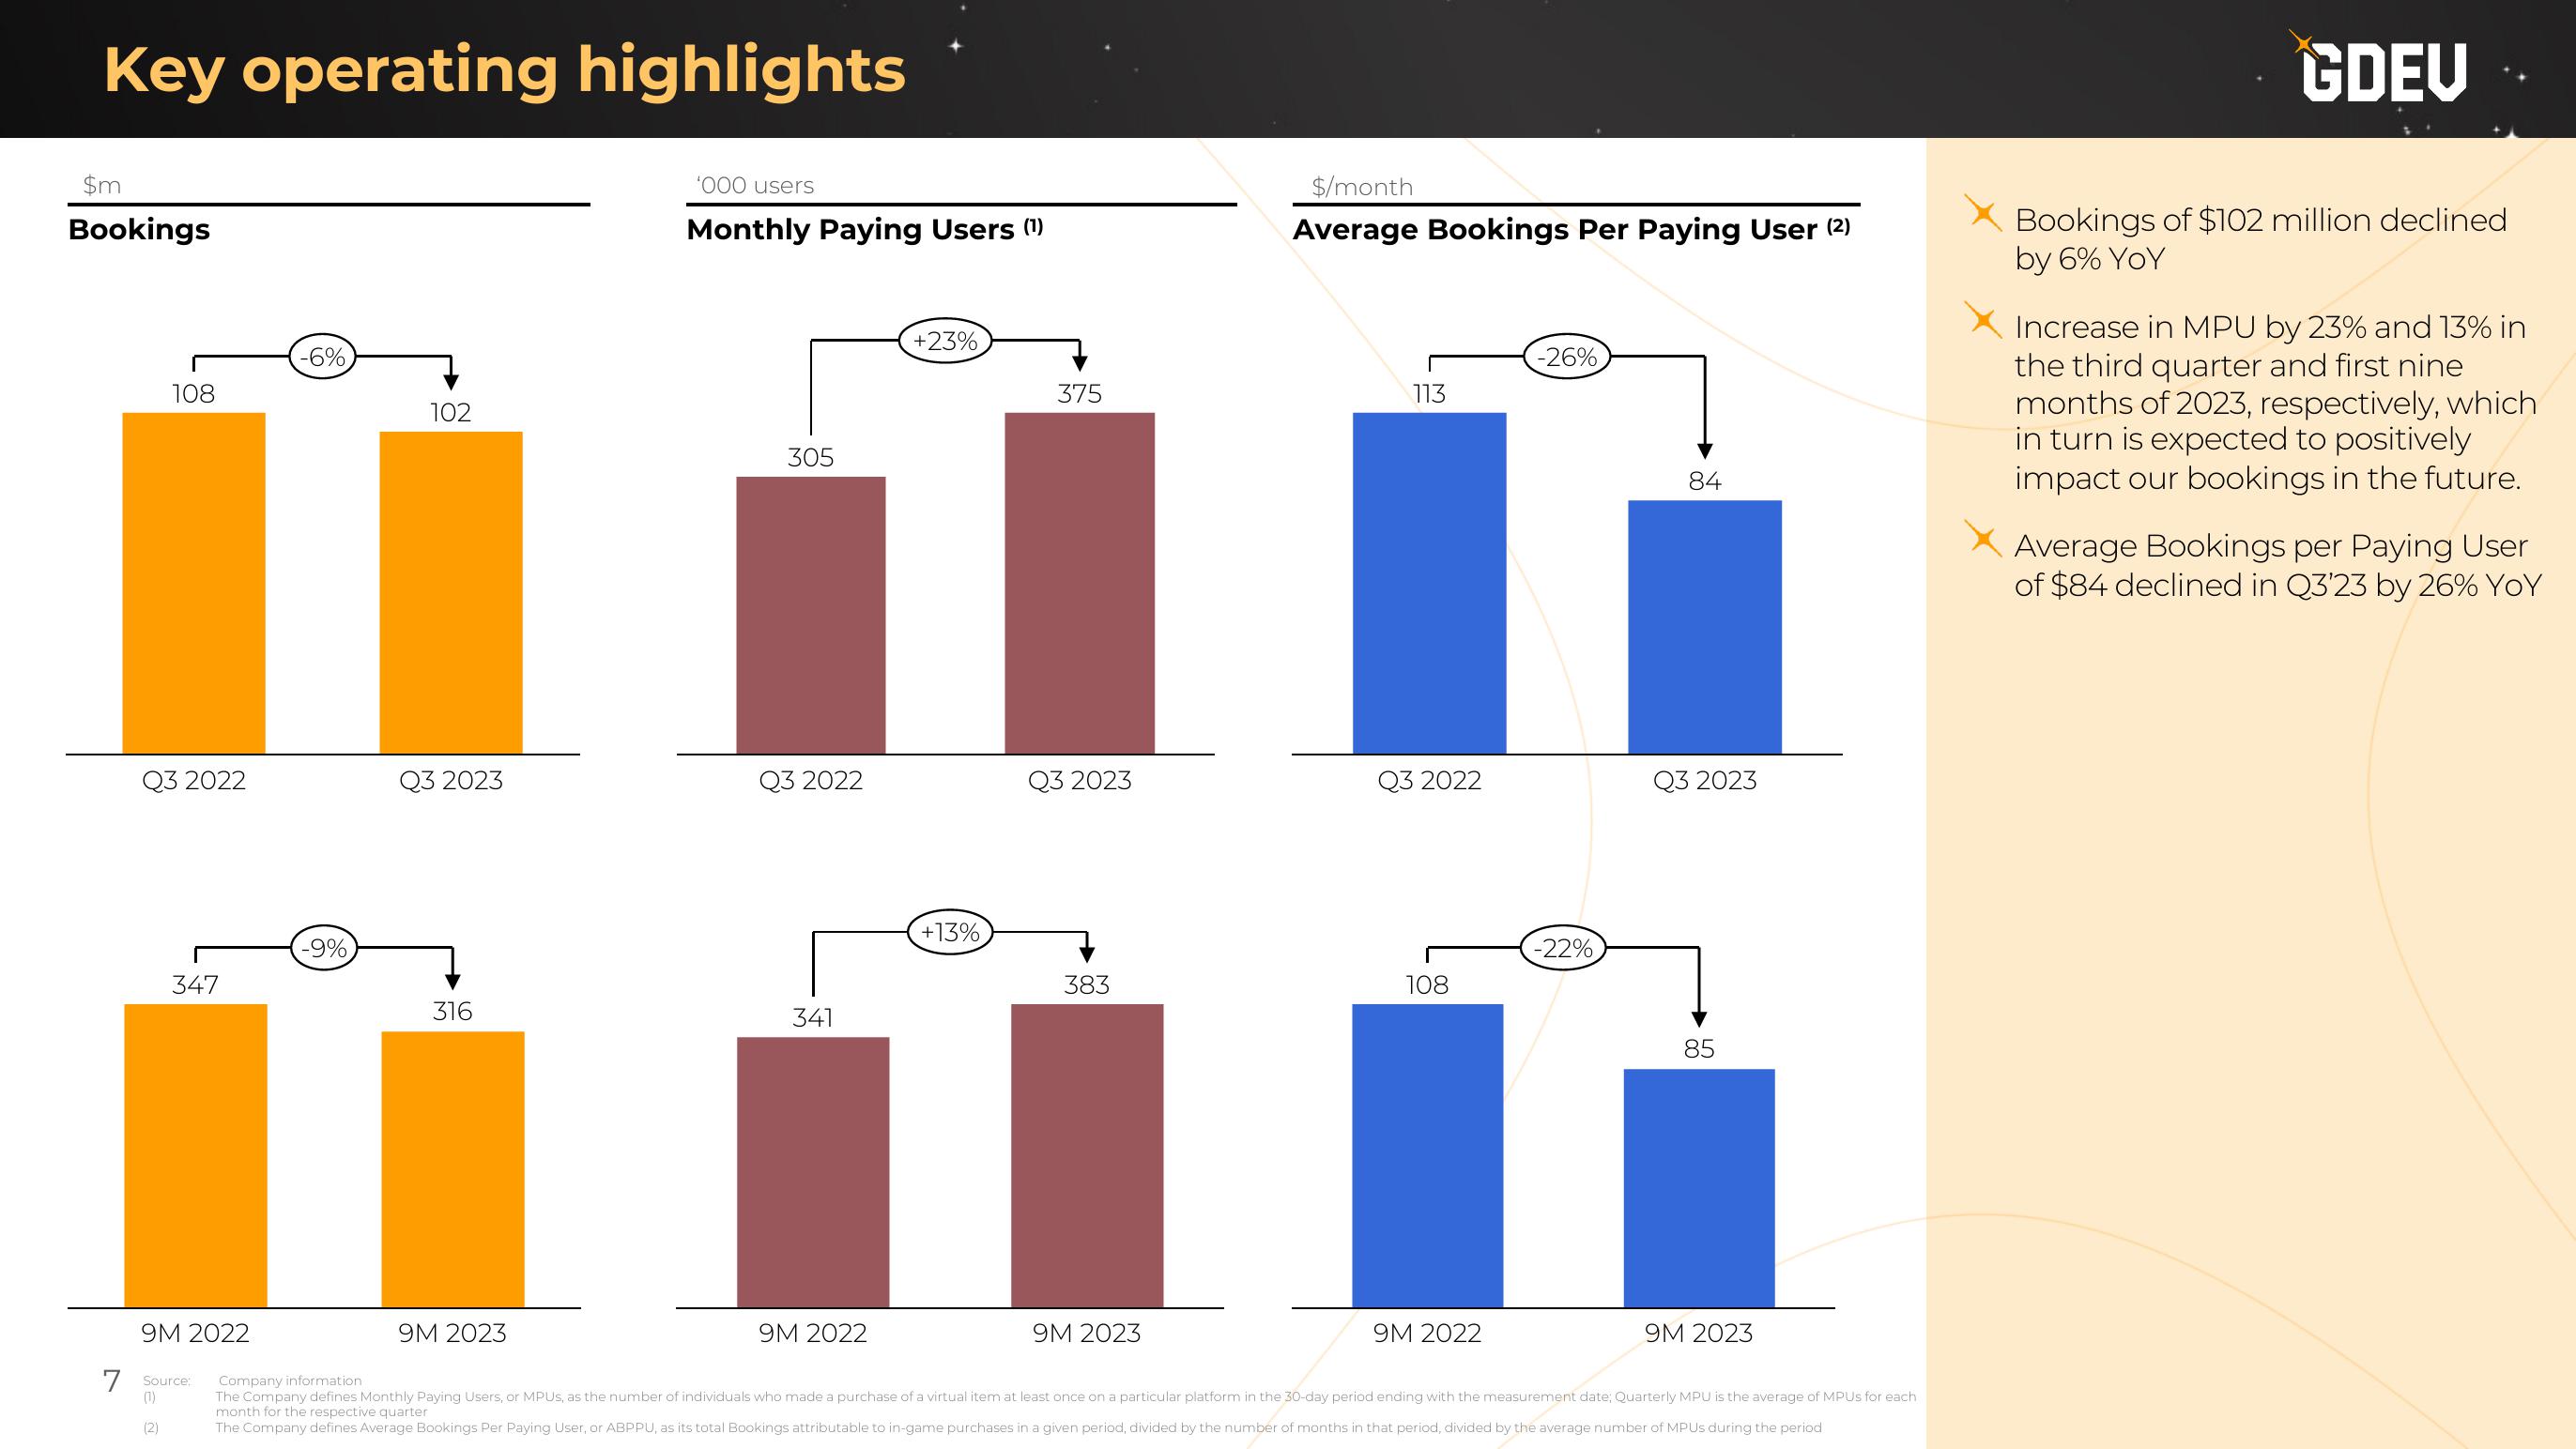
Bookings of $102 million declined
by 6% YoY
Increase in MPU by 23% and 13% in
the third quarter and first nine
months of 2023, respectively, which
in turn is expected to positively
impact our bookings in the future.
Average Bookings per Paying User
of $84 declined in Q3'23 by 26% YoYView entire presentation