KKR Real Estate Finance Trust Results Presentation Deck
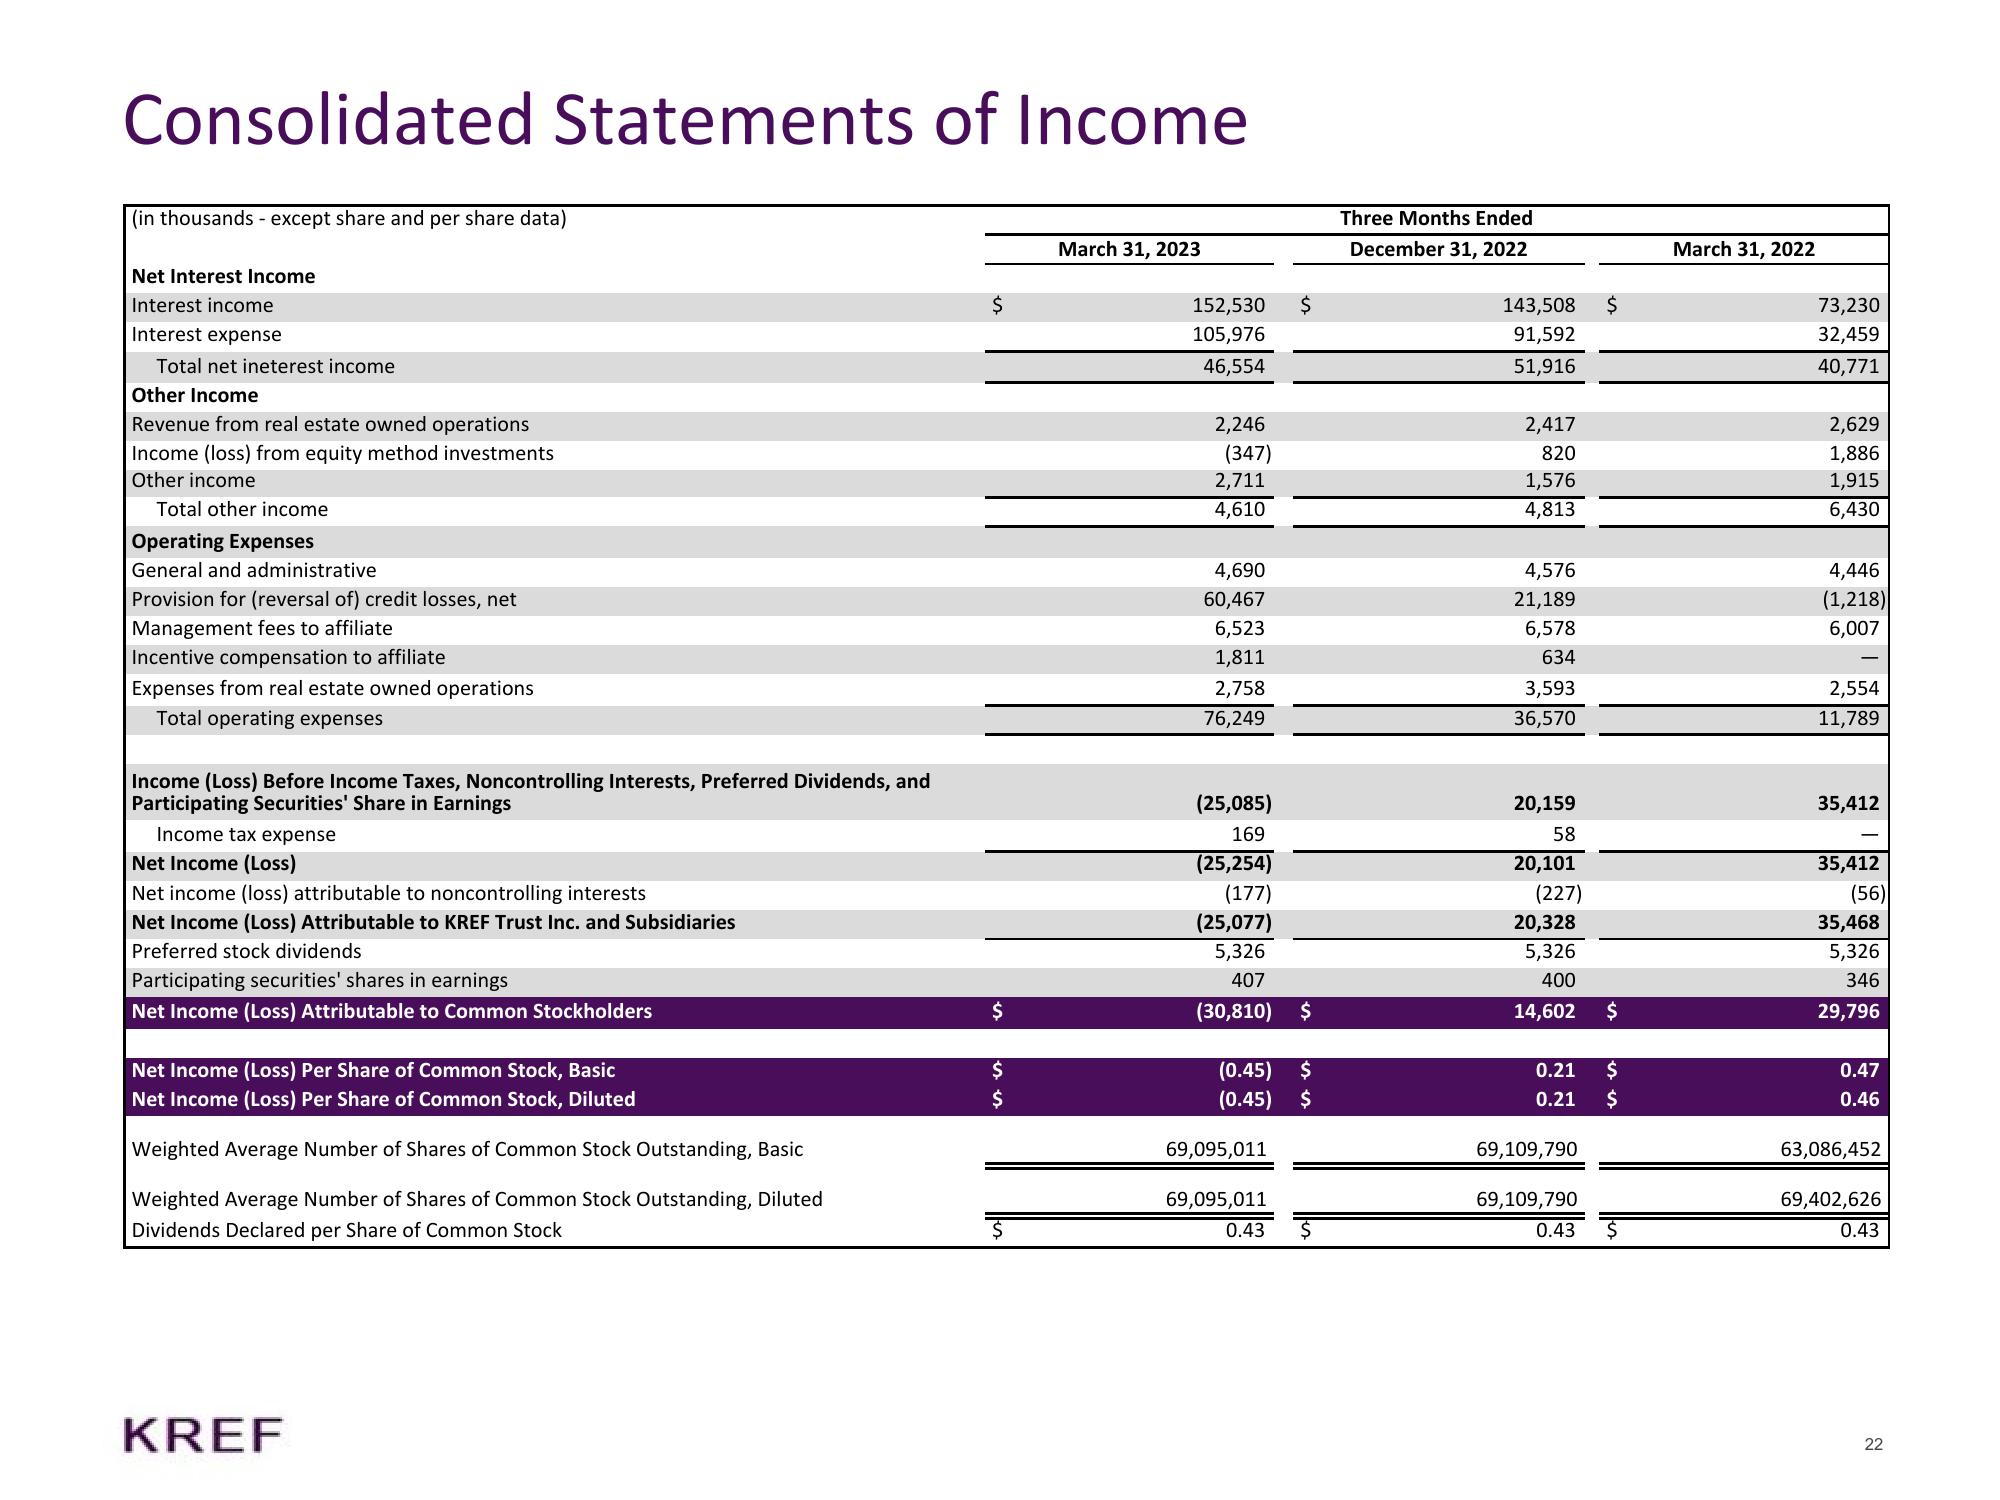
Consolidated Statements of Income
(in thousands - except share and per share data)
Net Interest Income
Interest income
Interest expense
Total net ineterest income
Other Income
Revenue from real estate owned operations
Income (loss) from equity method investments
Other income
Total other income
Operating Expenses
General and administrative
Provision for (reversal of) credit losses, net
Management fees to affiliate
Incentive compensation to affiliate
Expenses from real estate owned operations
Total operating expenses
Income (Loss) Before Income Taxes, Noncontrolling Interests, Preferred Dividends, and
Participating Securities' Share in Earnings
Income tax expense
Net Income (Loss)
Net income (loss) attributable to noncontrolling interests
Net Income (Loss) Attributable to KREF Trust Inc. and Subsidiaries
Preferred stock dividends
Participating securities' shares in earnings
Net Income (Loss) Attributable to Common Stockholders
Net Income (Loss) Per Share of Common Stock, Basic
Net Income (Loss) Per Share of Common Stock, Diluted
Weighted Average Number of Shares of Common Stock Outstanding, Basic
Weighted Average Number of Shares of Common Stock Outstanding, Diluted
Dividends Declared per Share of Common Stock
KREF
$
$
$
$
March 31, 2023
152,530
105,976
46,554
2,246
(347)
2,711
4,610
4,690
60,467
6,523
1,811
2,758
76,249
$
(25,085)
169
(25,254)
(177)
(25,077)
5,326
407
(30,810) $
(0.45) $
(0.45) $
69,095,011
69,095,011
0.43
Three Months Ended
December 31, 2022
143,508
91,592
51,916
2,417
820
1,576
4,813
4,576
21,189
6,578
634
3,593
36,570
20,159
58
20,101
(227)
20,328
5,326
400
14,602 $
0.21
0.21
69,109,790
69,109,790
0.43
$
$
March 31, 2022
73,230
32,459
40,771
2,629
1,886
1,915
6,430
4,446
(1,218)
6,007
2,554
11,789
35,412
35,412
(56)
35,468
5,326
346
29,796
0.47
0.46
63,086,452
69,402,626
0.43
22View entire presentation