Credit Suisse Investment Banking Pitch Book
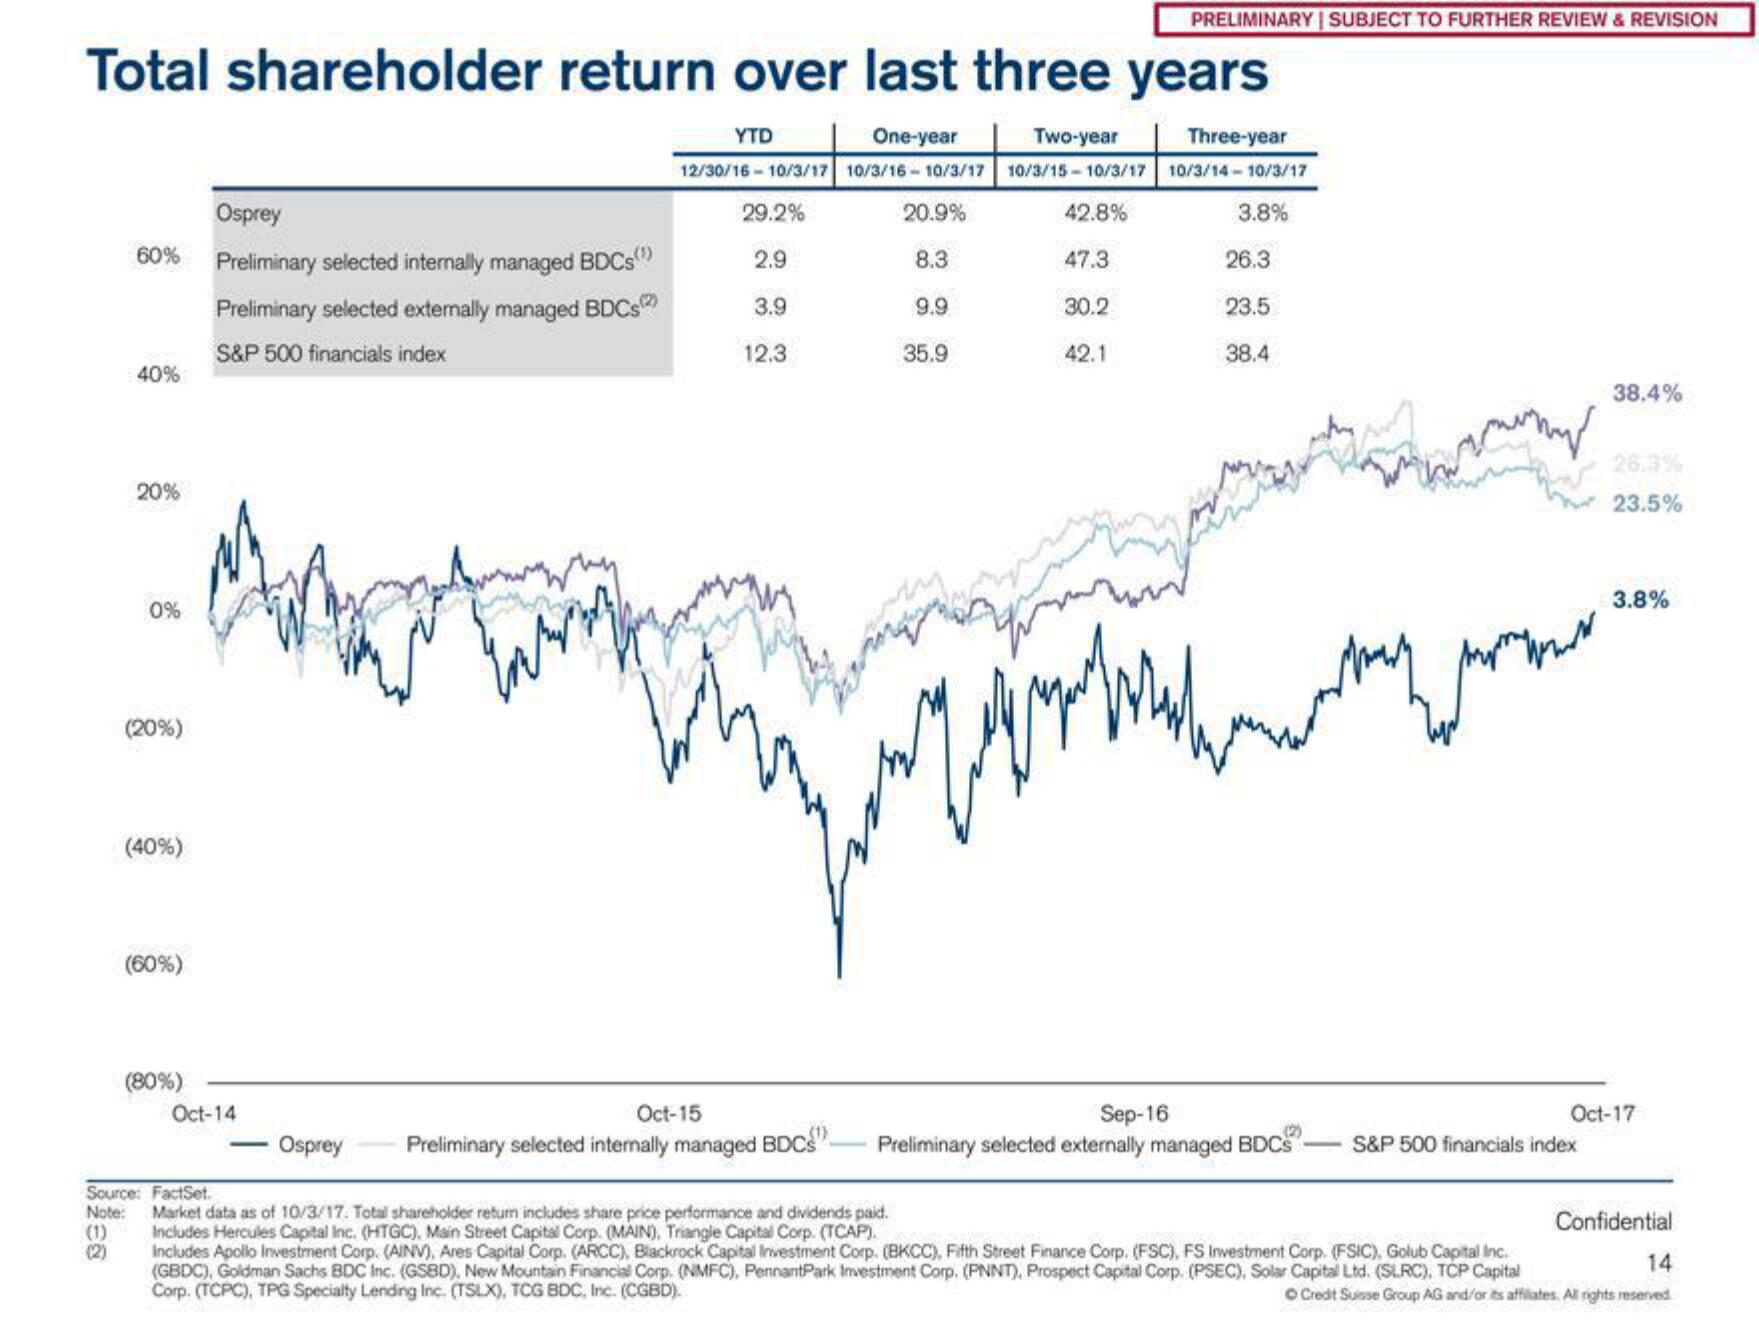
Total shareholder return over last three years
YTD
One-year
Two-year
Three-year
12/30/16 - 10/3/17 10/3/16-10/3/17 10/3/15-10/3/17 10/3/14-10/3/17
29.2%
20.9%
42.8%
3.8%
2.9
8.3
3.9
9.9
12.3
35.9
60%
(1)
(2)
40%
20%
0%
(20%)
(40%)
(60%)
(80%)
Osprey
Preliminary selected internally managed BDCs)
Preliminary selected externally managed BDCs)
S&P 500 financials index
Oct-14
Osprey
Oct-15
Preliminary selected internally managed BDCS"
Zeroch
Wy
47.3
30.2
42.1
PRELIMINARY | SUBJECT TO FURTHER REVIEW & REVISION
www
26.3
23.5
38.4
Sep-16
Preliminary selected externally managed BDCS
en
38.4%
S&P 500 financials index
26.3%
23.5%
3.8%
Oct-17
Source: FactSet.
Note: Market data as of 10/3/17. Total shareholder return includes share price performance and dividends paid.
Includes Hercules Capital Inc. (HTGC), Main Street Capital Corp. (MAIN), Triangle Capital Corp. (TCAP).
Includes Apollo Investment Corp. (AINV), Ares Capital Corp. (ARCC), Blackrock Capital Investment Corp. (BKCC), Fifth Street Finance Corp. (FSC), FS Investment Corp. (FSIC), Golub Capital Inc.
(GBDC), Goldman Sachs BDC Inc. (GSBD), New Mountain Financial Corp. (NMFC), Pennant Park Investment Corp. (PNNT), Prospect Capital Corp. (PSEC), Solar Capital Ltd. (SLRC), TCP Capital
Corp. (TCPC), TPG Specialty Lending Inc. (TSLX), TCG BDC, Inc. (CGBD).
Credit Suisse Group AG and/or its affiliates. All rights reserved.
14
ConfidentialView entire presentation