Embark Investor Presentation Deck
FINANCIAL FRAMEWORK
1)
2)
3)
Top-Down Approach
The total addressable market for
Embark's technology is large, even
at small adoption levels
We are already analyzing the
opportunity with partners,
evaluating where autonomous
trucking is economical, and working
together to refine the plan to
operationalize and commercialize
our technology at scale.
The need for Embark's technology
is clear and present
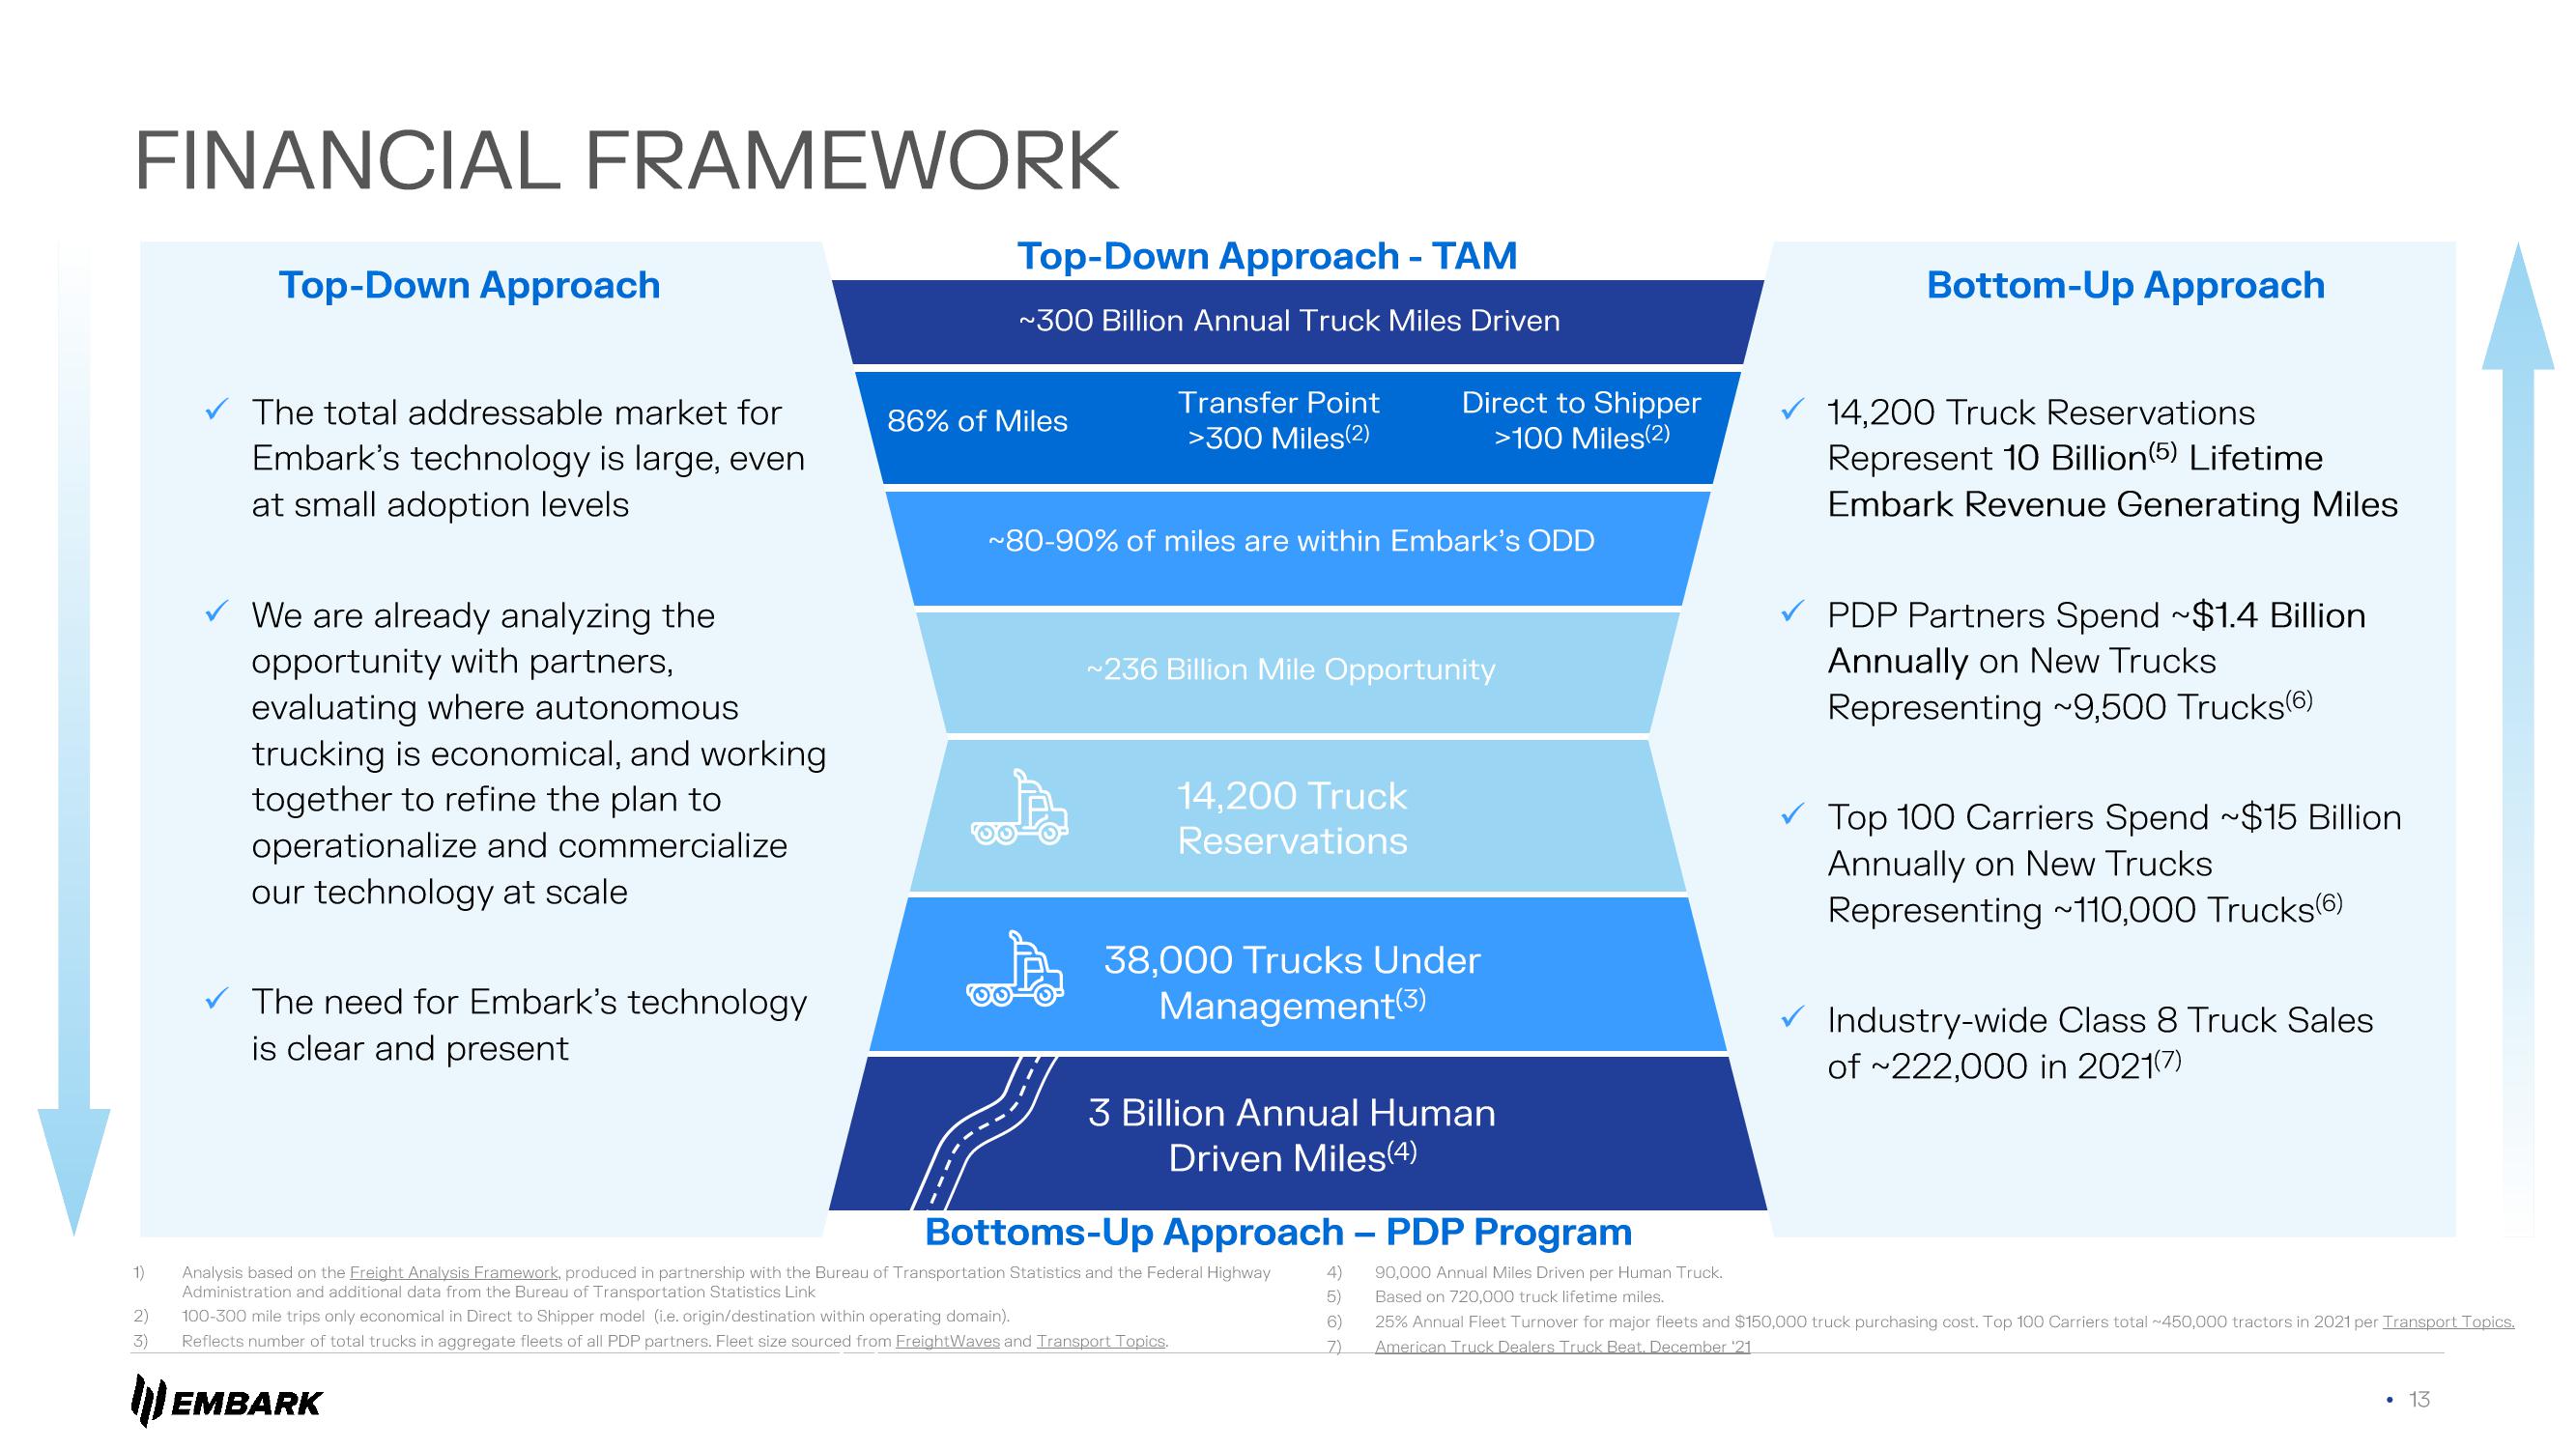
Top-Down Approach - TAM
~300 Billion Annual Truck Miles Driven
EMBARK
86% of Miles
Transfer Point
>300 Miles(2)
~80-90% of miles are within Embark's ODD
Direct to Shipper
>100 Miles(2)
~236 Billion Mile Opportunity
14,200 Truck
Reservations
38,000 Trucks Under
Management (3)
3 Billion Annual Human
Driven Miles(4)
Analysis based on the Freight Analysis Framework, produced in partnership with the Bureau of Transportation Statistics and the Federal Highway
Administration and additional data from the Bureau of Transportation Statistics Link
100-300 mile trips only economical in Direct to Shipper model (i.e. origin/destination within operating domain).
Reflects number of total trucks in aggregate fleets of all PDP partners. Fleet size sourced from FreightWaves and Transport Topics.
Bottoms-Up Approach - PDP Program
4) 90,000 Annual Miles Driven per Human Truck.
(5)
Based on 720,000 truck lifetime miles.
6)
7)
Bottom-Up Approach
14,200 Truck Reservations
Represent 10 Billion(5) Lifetime
Embark Revenue Generating Miles
PDP Partners Spend ~$1.4 Billion
Annually on New Trucks
Representing ~9,500 Trucks(6)
Top 100 Carriers Spend ~$15 Billion
Annually on New Trucks
Representing ~110,000 Trucks(6)
Industry-wide Class 8 Truck Sales
of ~222,000 in 2021(7)
25% Annual Fleet Turnover for major fleets and $150,000 truck purchasing cost. Top 100 Carriers total ~450,000 tractors in 2021 per Transport Topics.
American Truck Dealers Truck Beat. December ¹21
• 13View entire presentation