Wix Results Presentation Deck
leverage our relationships with third party cloud hosting providers to quickly
and efficiently scale our capacity against the demands from our rapidly
growing user base. Further, because we do not operate data centers internally,
we do not have any depreciation expenses in cost of revenue for server
hardware. As a result, we continue to deliver best in class gross margins.
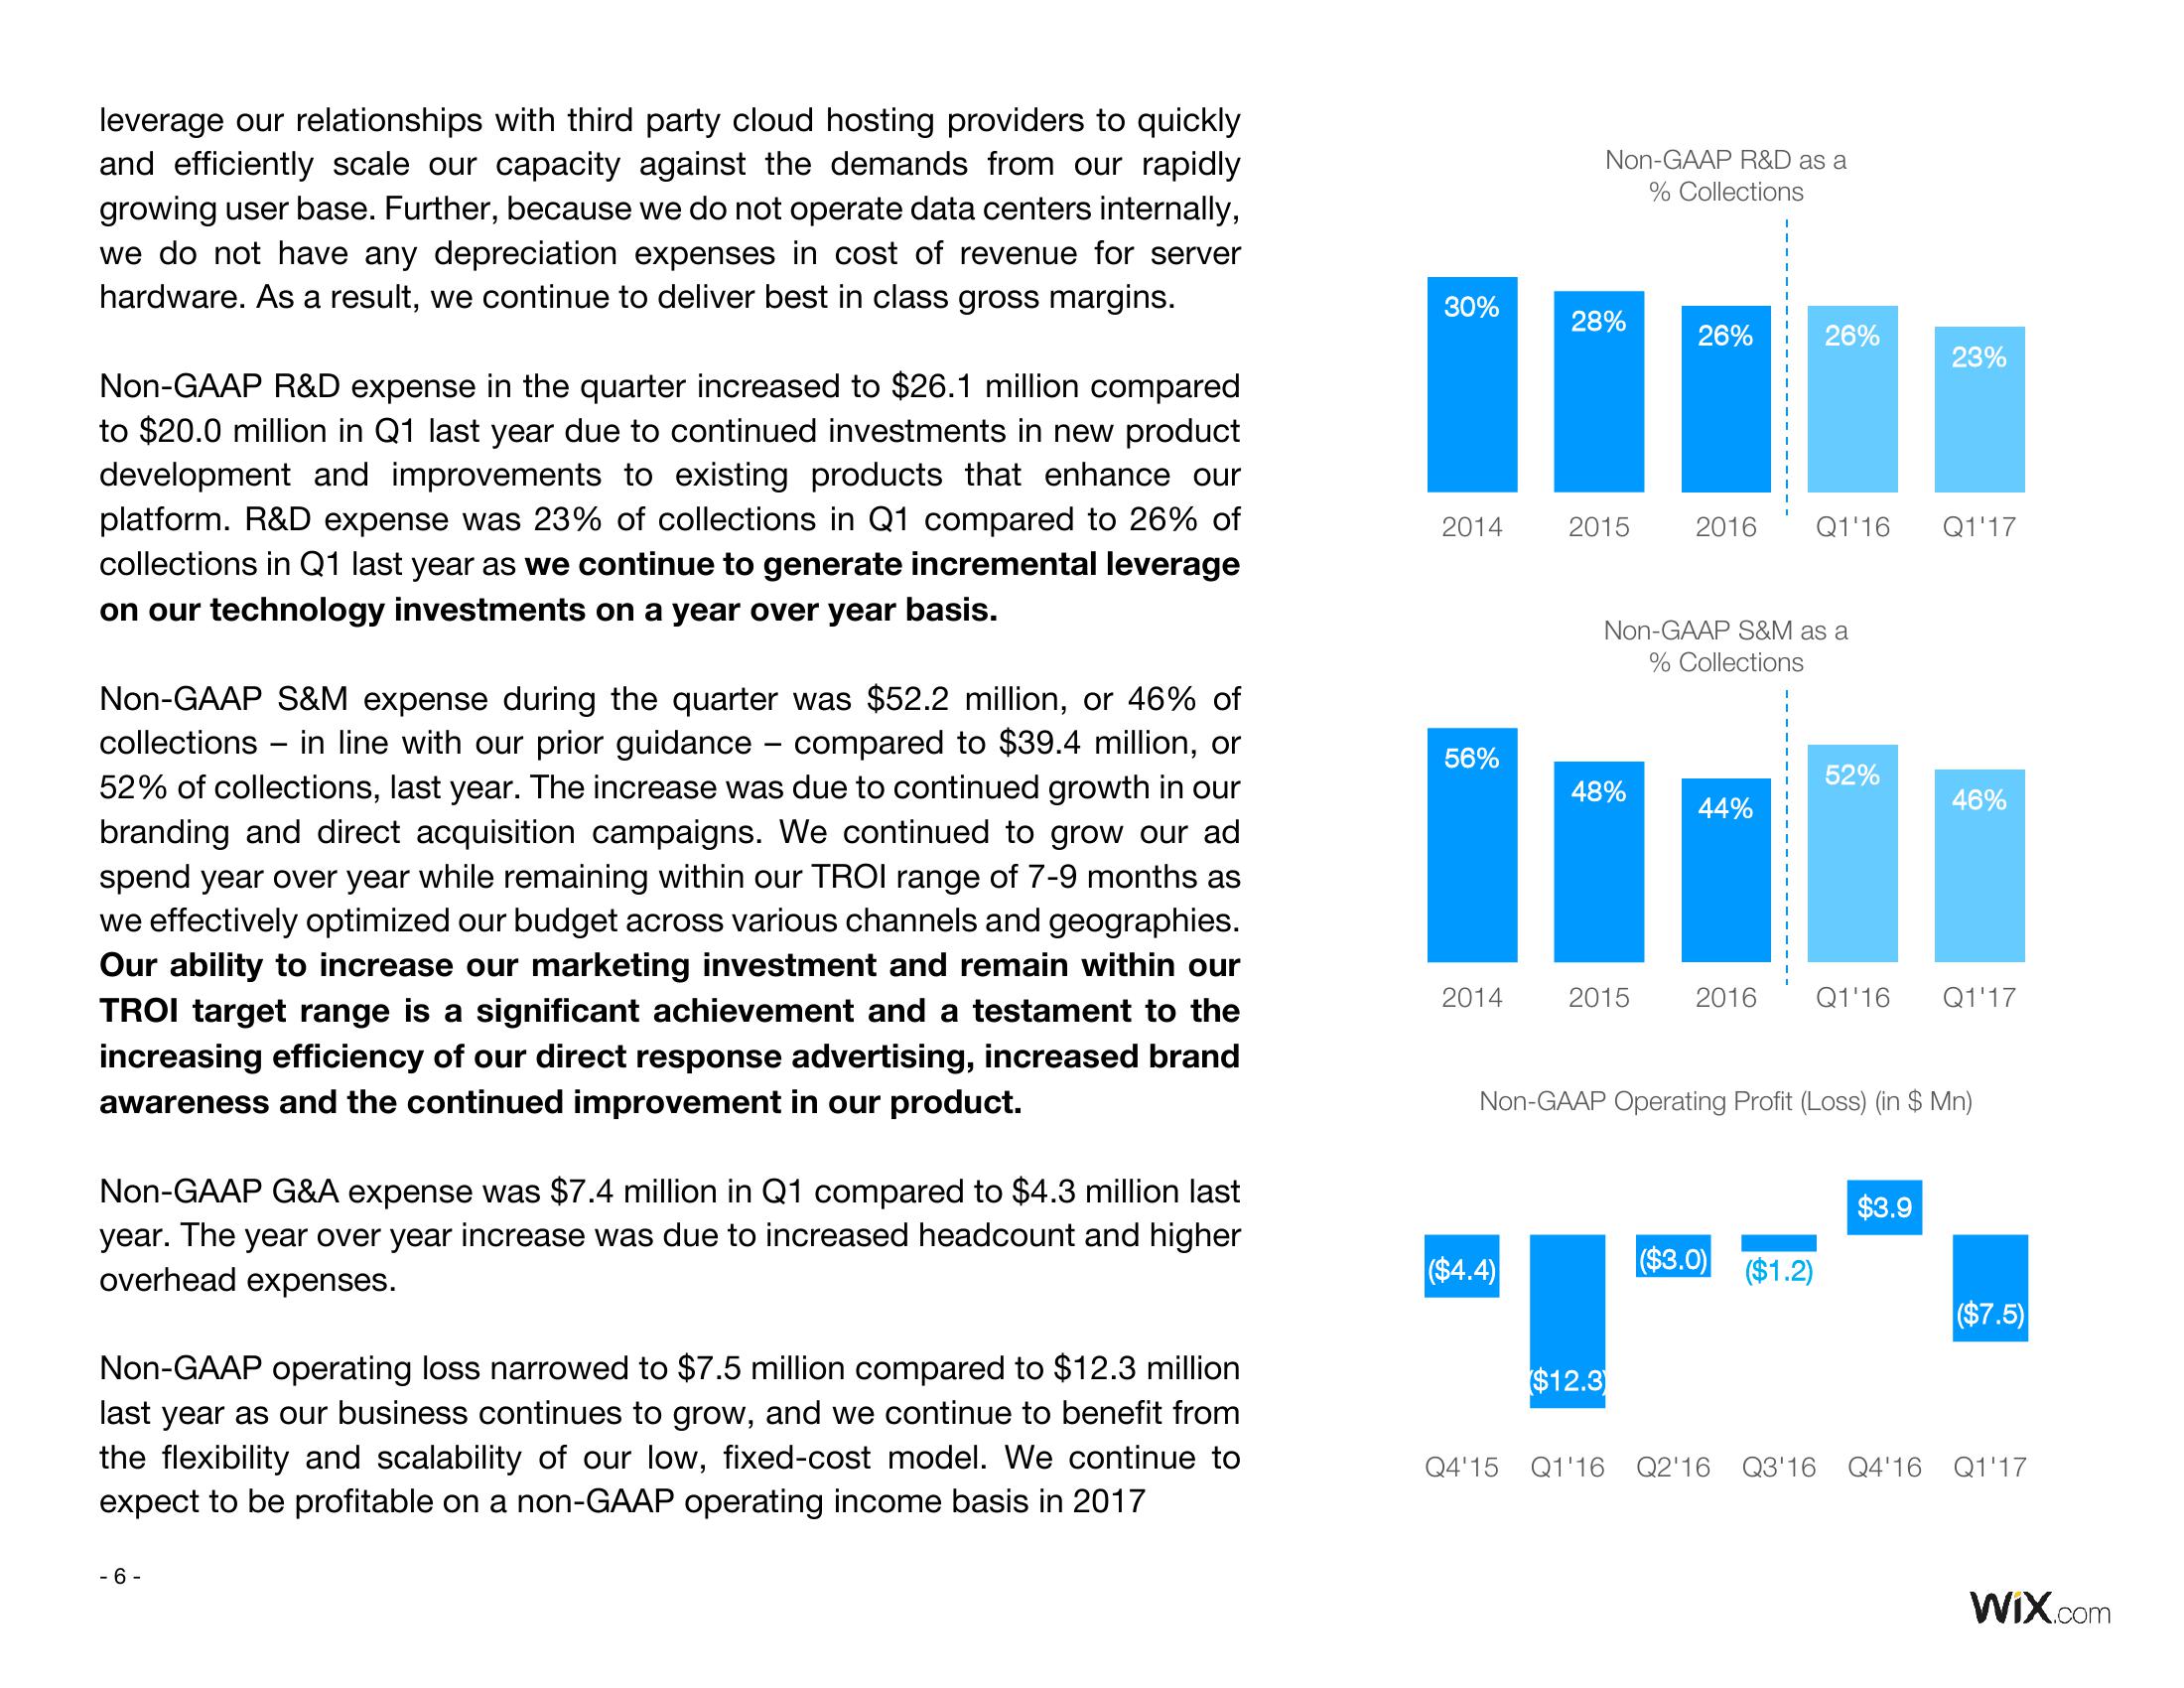
Non-GAAP R&D expense in the quarter increased to $26.1 million compared
to $20.0 million in Q1 last year due to continued investments in new product
development and improvements to existing products that enhance our
platform. R&D expense was 23% of collections in Q1 compared to 26% of
collections in Q1 last year as we continue to generate incremental leverage
on our technology investments on a year over year basis.
-
Non-GAAP S&M expense during the quarter was $52.2 million, or 46% of
collections in line with our prior guidance – compared to $39.4 million, or
52% of collections, last year. The increase was due to continued growth in our
branding and direct acquisition campaigns. We continued to grow our ad
spend year over year while remaining within our TROI range of 7-9 months as
we effectively optimized our budget across various channels and geographies.
Our ability to increase our marketing investment and remain within our
TROI target range is a significant achievement and a testament to the
increasing efficiency of our direct response advertising, increased brand
awareness and the continued improvement in our product.
-
Non-GAAP G&A expense was $7.4 million in Q1 compared to $4.3 million last
year. The year over year increase was due to increased headcount and higher
overhead expenses.
Non-GAAP operating loss narrowed to $7.5 million compared to $12.3 million
last year as our business continues to grow, and we continue to benefit from
the flexibility and scalability of our low, fixed-cost model. We continue to
expect to be profitable on a non-GAAP operating income basis in 2017
- 6-
30%
2014
56%
2014
($4.4)
Non-GAAP R&D as a
% Collections
28%
2015
48%
2015
$12.3
26%
Non-GAAP S&M as a
% Collections
Q4'15 Q1'16
26%
2016 Q1'16 Q1'17
44%
52%
Non-GAAP Operating Profit (Loss) (in $ Mn)
($3.0) ($1.2)
23%
2016 Q1'16 Q1'17
46%
$3.9
($7.5)
Q2'16 Q3'16 Q4'16 Q1'17
WIX.comView entire presentation