Melrose Results Presentation Deck
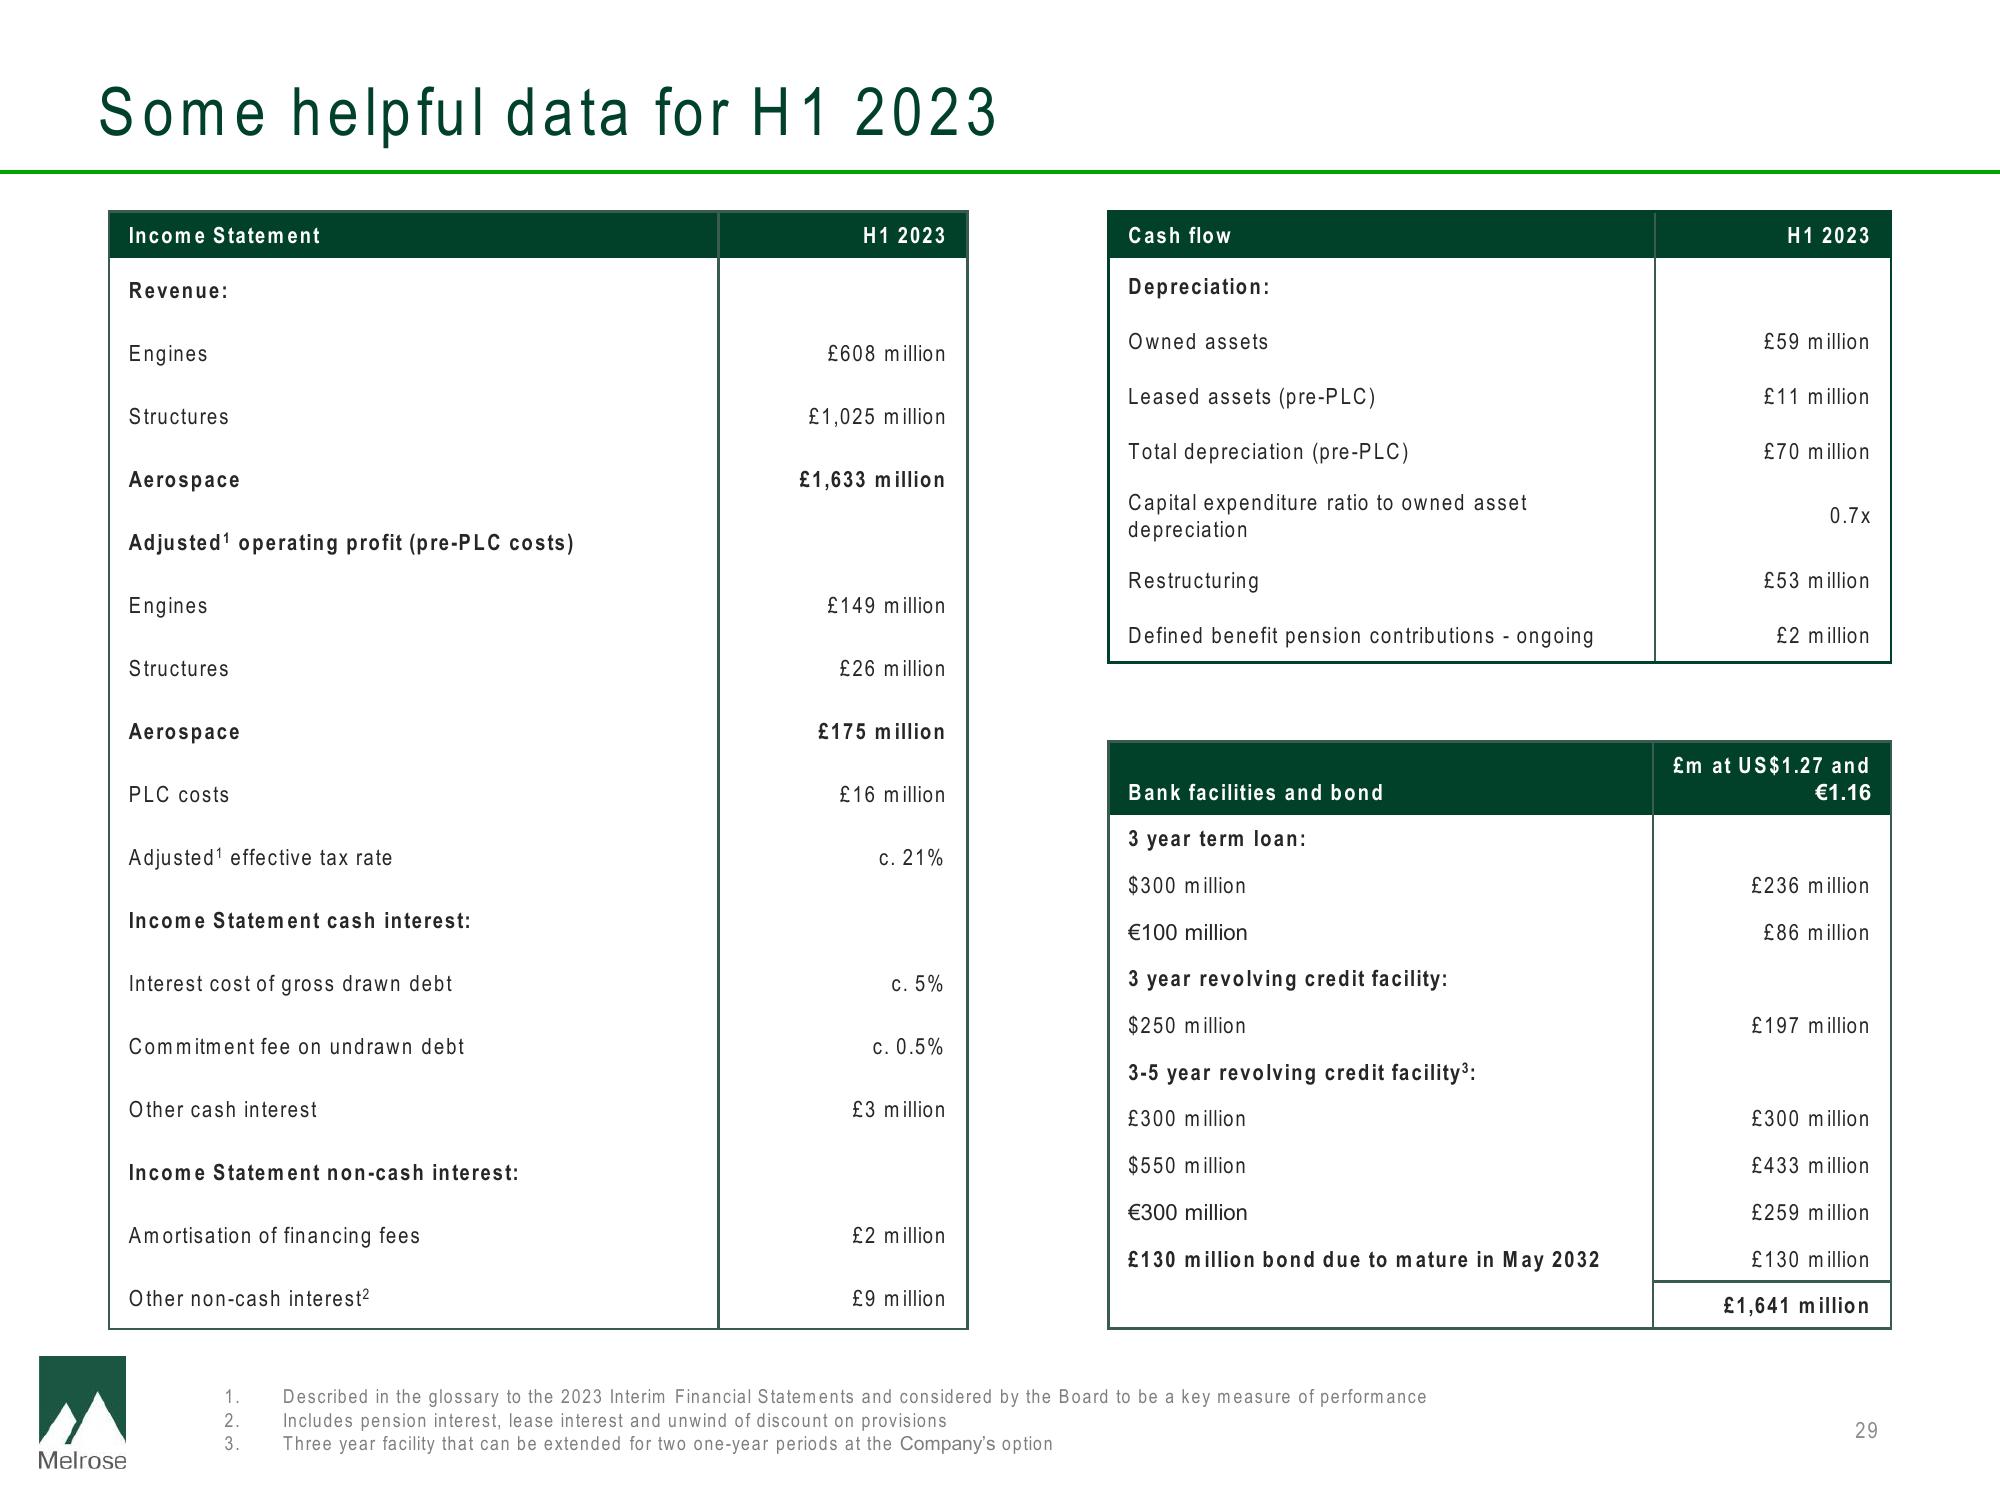
Some helpful data for H1 2023
Melrose
Income Statement
Revenue:
Engines
Structures
Aerospace
Adjusted¹ operating profit (pre-PLC costs)
Engines
Structures
Aerospace
PLC costs
Adjusted¹ effective tax rate
Income Statement cash interest:
Interest cost of gross drawn debt
Commitment fee on undrawn debt
Other cash interest
Income Statement non-cash interest:
Amortisation of financing fees
Other non-cash interest²
1.
2.
3.
H1 2023
£608 million
£1,025 million
£1,633 million
£149 million
£26 million
£175 million
£16 million
c. 21%
c. 5%
c. 0.5%
£3 million
£2 million
£9 million
Cash flow
Depreciation:
Owned assets.
Leased assets (pre-PLC)
Total depreciation (pre-PLC)
Capital expenditure ratio to owned asset
depreciation
Restructuring
Defined benefit pension contributions - ongoing
Bank facilities and bond
3 year term loan:
$300 million.
€100 million
3 year revolving credit facility:
$250 million
3-5 year revolving credit facility³:
£300 million
$550 million
€300 million
£130 million bond due to mature in May 2032
Described in the glossary to the 2023 Interim Financial Statements and considered by the Board to be a key measure of performance
Includes pension interest, lease interest and unwind of discount on provisions
Three year facility that can be extended for two one-year periods at the Company's option
H1 2023
£59 million
£11 million
£70 million
0.7x
£53 million
£2 million.
£m at US$1.27 and
€1.16
£236 million
£86 million
£197 million
£300 million
£433 million
£259 million
£130 million
£1,641 million
29View entire presentation