Moelis & Company Investor Presentation Deck
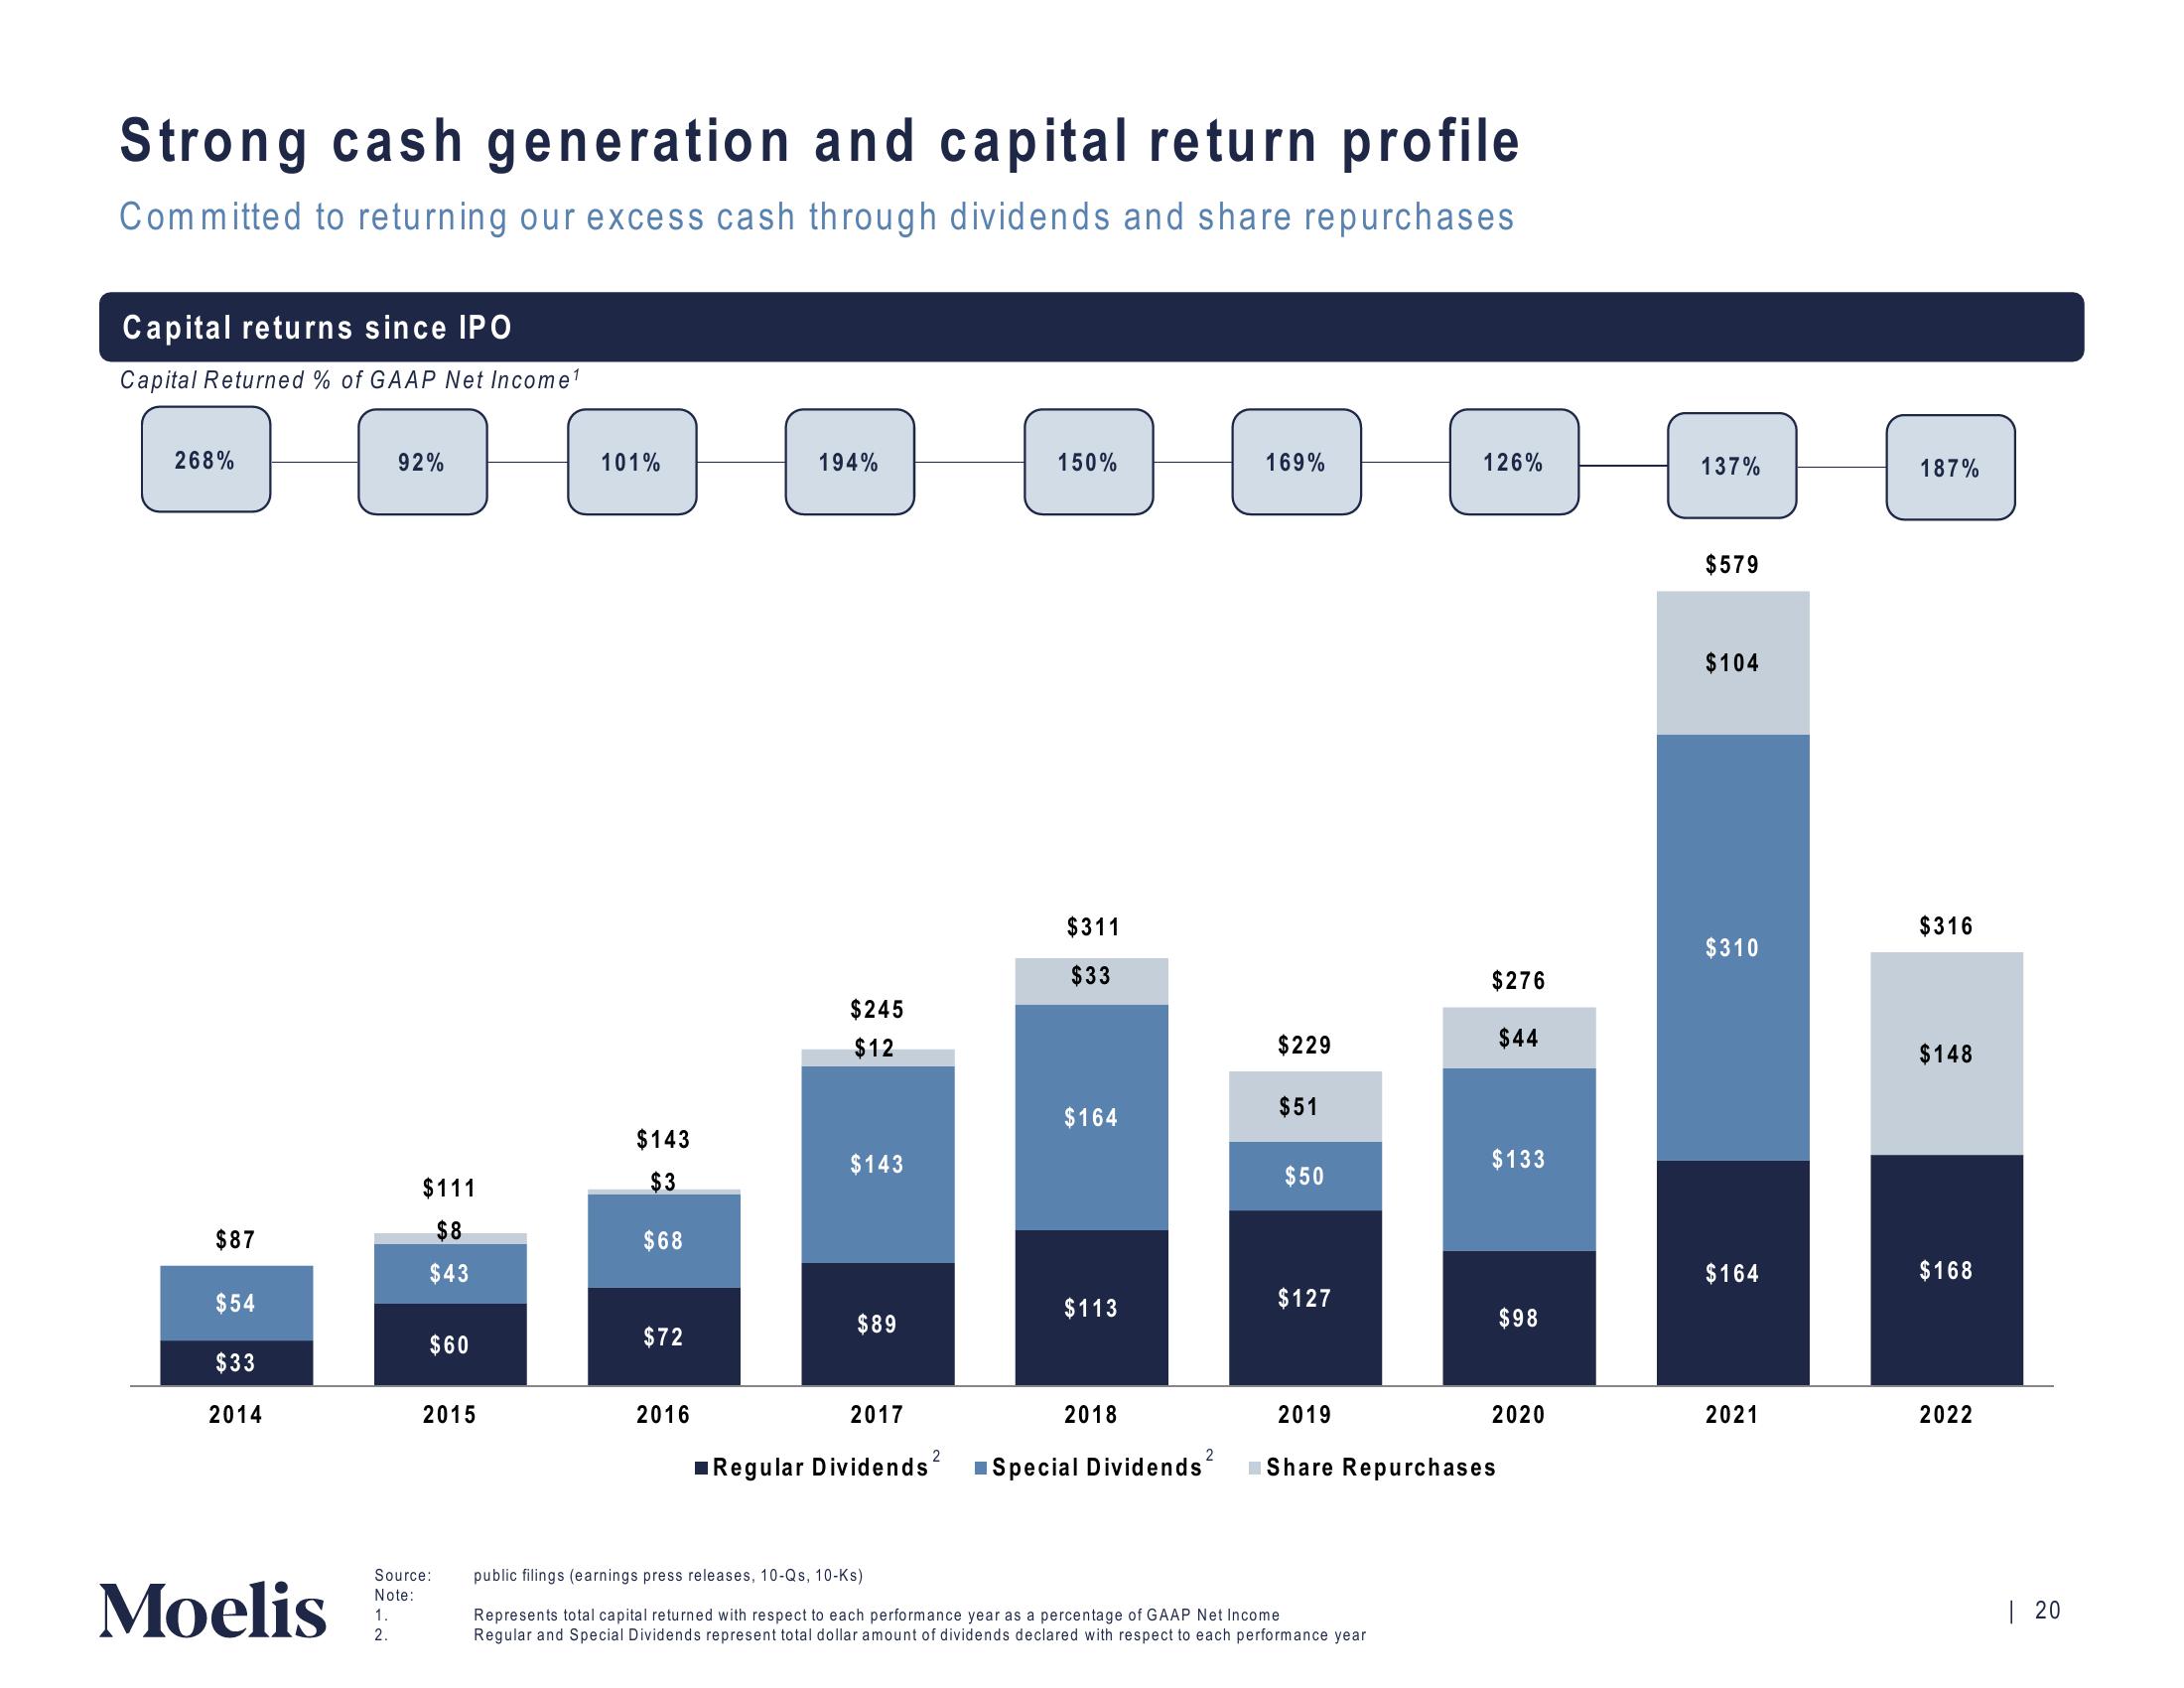
Strong cash generation and capital return profile
Committed to returning our excess cash through dividends and share repurchases
Capital returns since IPO
Capital Returned % of GAAP Net Income¹
268%
$87
$54
$33
2014
Moelis
92%
$111
$8
$43
$60
2015
101%
$143
$3
$68
$72
2016
194%
$245
$12
$143
$89
2017
Regular Dividends ²
Source: public filings (earnings press releases, 10-Qs, 10-Ks)
Note:
1.
2.
150%
$311
$33
$164
$113
2018
■ Special Dividends²
169%
$229
$51
$50
$127
126%
Represents total capital returned with respect to each performance year as a percentage of GAAP Net Income
Regular and Special Dividends represent total dollar amount of dividends declared with respect to each performance year
$276
$44
$133
2019
Share Repurchases
$98
2020
137%
$579
$104
$310
$164
2021
187%
$316
$148
$168
2022
| 20View entire presentation