Maersk Results Presentation Deck
Maersk Group
- Interim Report 03 2015
APM SHIPPING
SERVICES
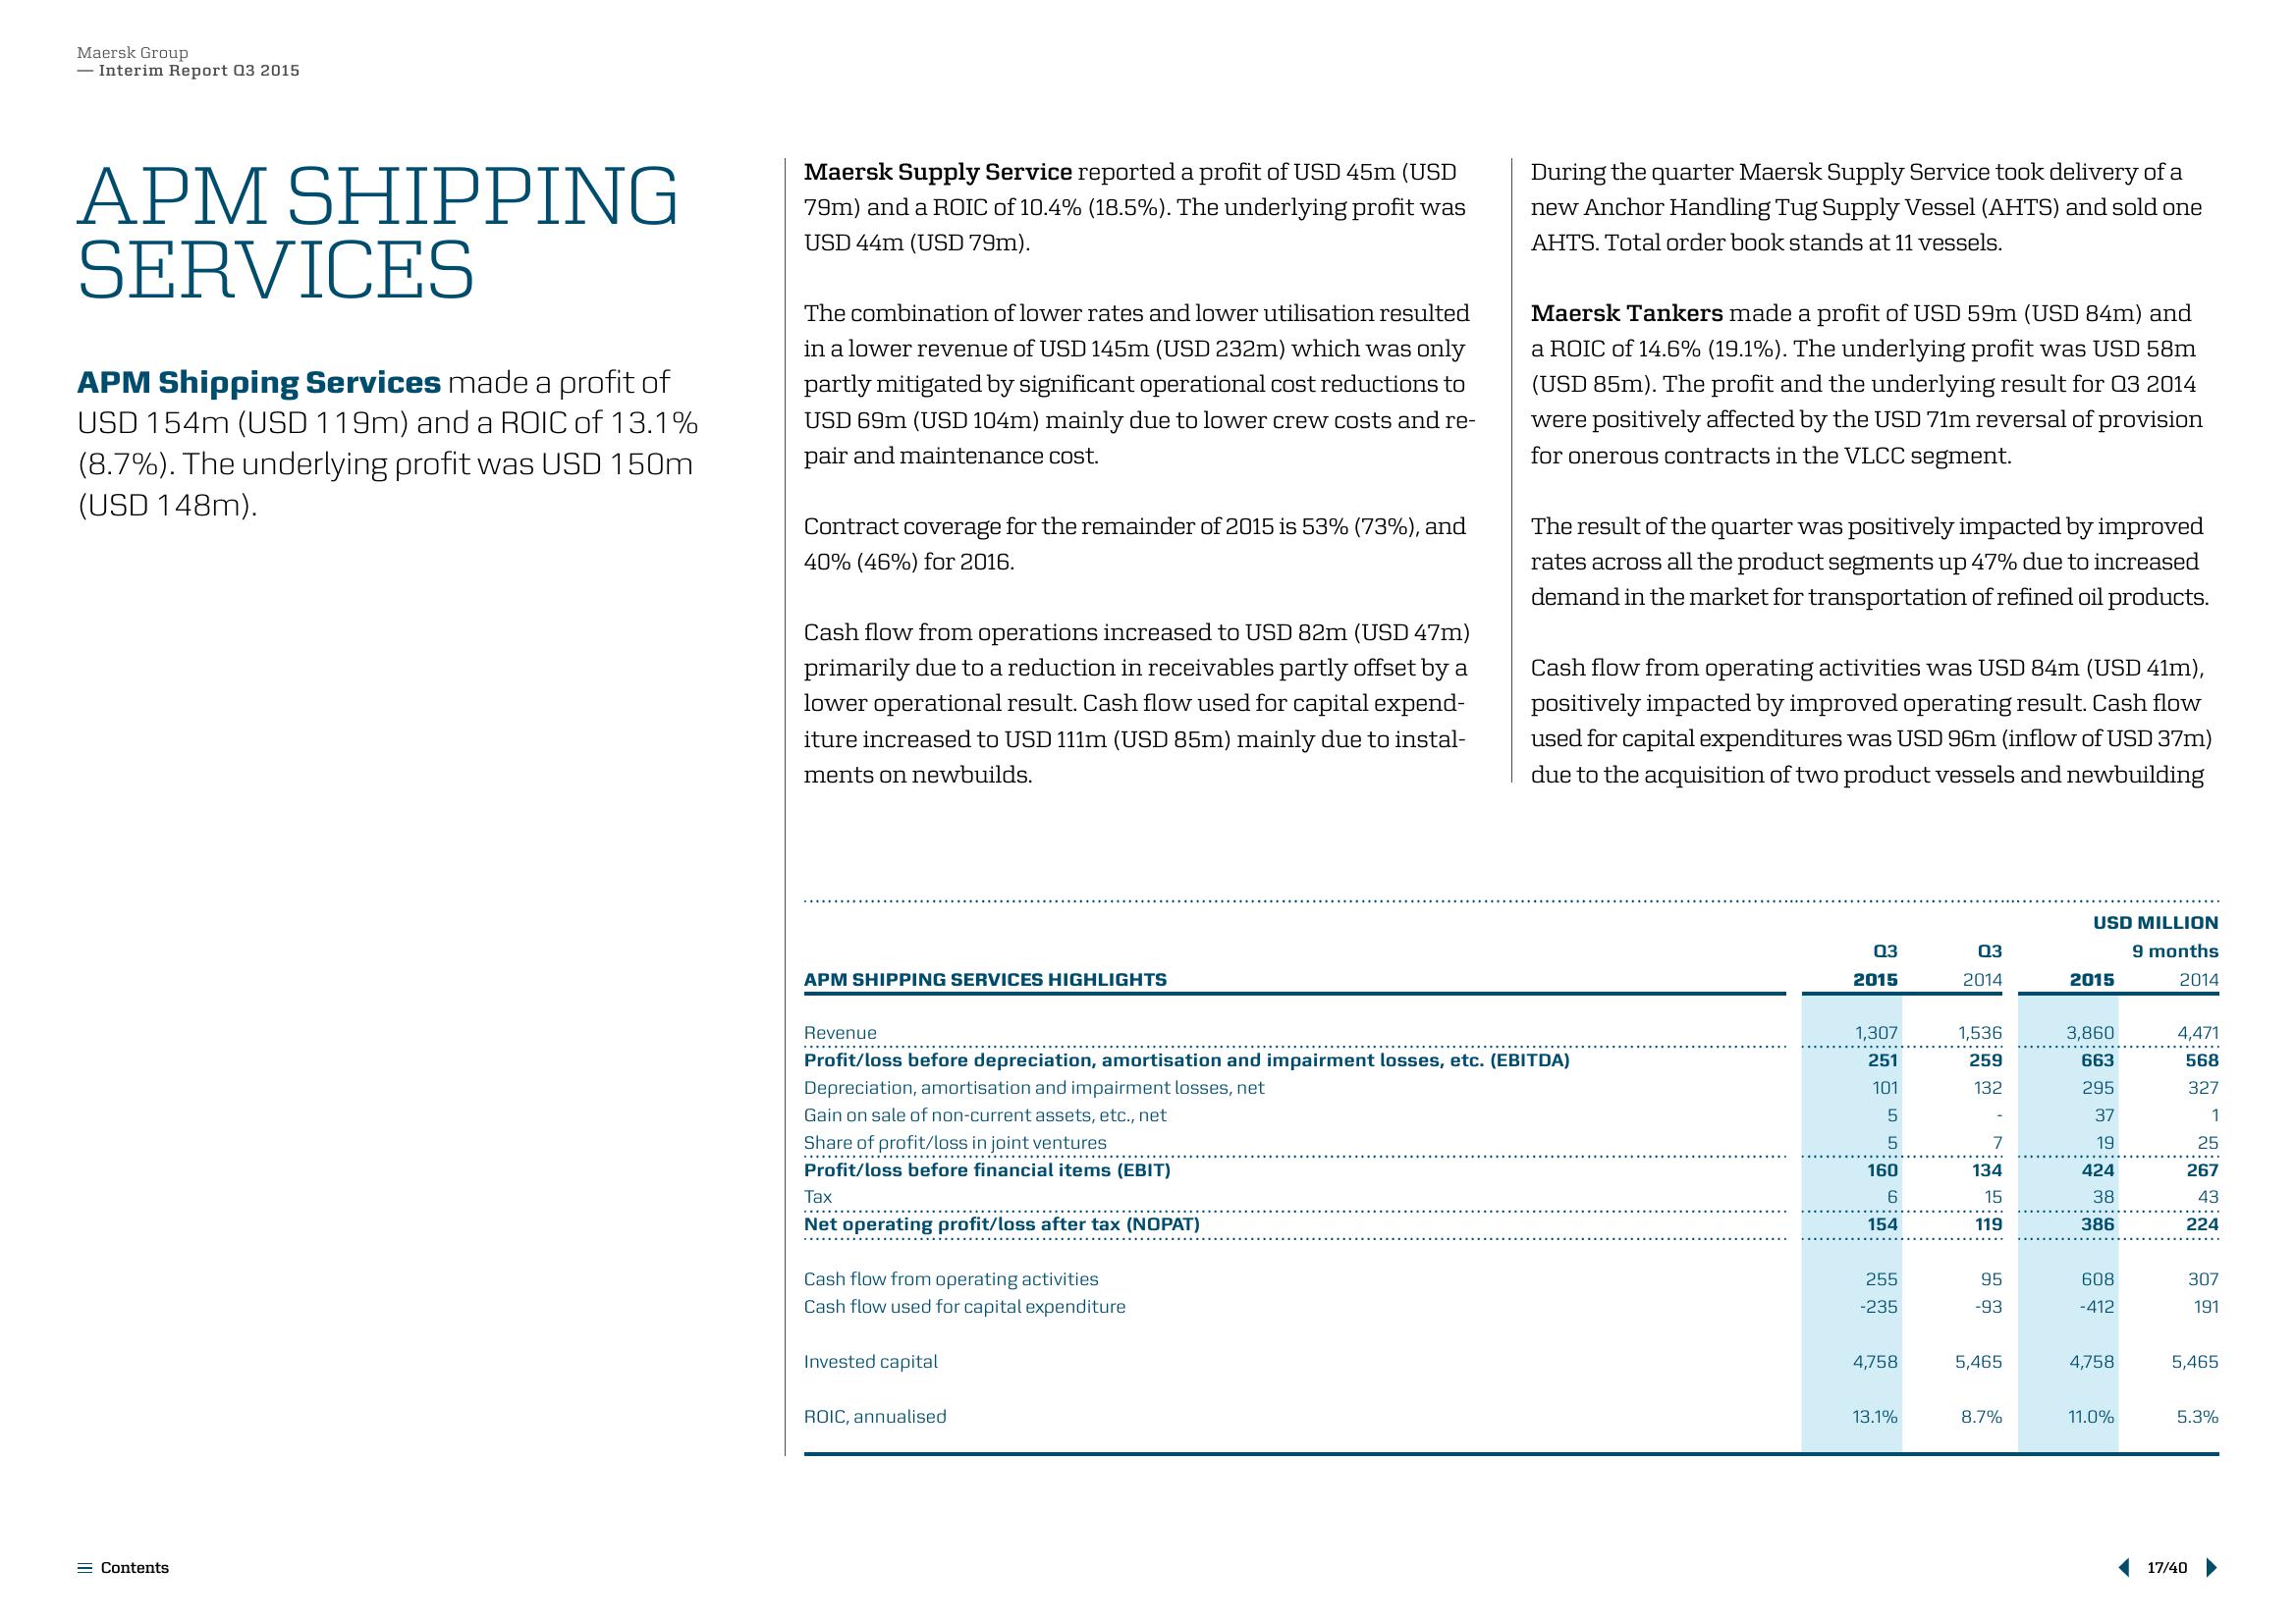
APM Shipping Services made a profit of
USD 154m (USD 119m) and a ROIC of 13.1%
(8.7%). The underlying profit was USD 150m
(USD 148m).
Contents
Maersk Supply Service reported a profit of USD 45m (USD
79m) and a ROIC of 10.4% (18.5%). The underlying profit was
USD 44m (USD 79m).
The combination of lower rates and lower utilisation resulted
in a lower revenue of USD 145m (USD 232m) which was only
partly mitigated by significant operational cost reductions to
USD 69m (USD 104m) mainly due to lower crew costs and re-
pair and maintenance cost.
Contract coverage for the remainder of 2015 is 53% (73%), and
40% (46%) for 2016.
Cash flow from operations increased to USD 82m (USD 47m)
primarily due to a reduction in receivables partly offset by a
lower operational result. Cash flow used for capital expend-
iture increased to USD 111m (USD 85m) mainly due to instal-
ments on newbuilds.
APM SHIPPING SERVICES HIGHLIGHTS
Revenue
***********
.……..….….…..….
Tax
Net operating profit/loss after tax (NOPAT)
Cash flow from operating activities
Cash flow used for capital expenditure
Profit/loss before depreciation, amortisation and impairment losses, etc. (EBITDA)
Depreciation, amortisation and impairment losses, net
Gain on sale of non-current assets, etc., net
Share of profit/loss in joint ventures
Profit/loss before financial items (EBIT)
Invested capital
During the quarter Maersk Supply Service took delivery of a
new Anchor Handling Tug Supply Vessel (AHTS) and sold one
AHTS. Total order book stands at 11 vessels.
ROIC, annualised
Maersk Tankers made a profit of USD 59m (USD 84m) and
a ROIC of 14.6% (19.1%). The underlying profit was USD 58m
(USD 85m). The profit and the underlying result for Q3 2014
were positively affected by the USD 71m reversal of provision
for onerous contracts in the VLCC segment.
The result of the quarter was positively impacted by improved
rates across all the product segments up 47% due to increased
demand in the market for transportation of refined oil products.
Cash flow from operating activities was USD 84m (USD 41m),
positively impacted by improved operating result. Cash flow
used for capital expenditures was USD 96m (inflow of USD 37m)
due to the acquisition of two product vessels and newbuilding
03
2015
1,307
251
101
5
5
160
6
154
255
-235
4,758
13.1%
03
2014
1,536
259
132
7
134
15
119
95
-93
5,465
8.7%
USD MILLION
9 months
2014
2015
3,860
663
295
37
19
424
38
386
608
-412
4,758
11.0%
4,471
568
327
1
25
267
43
224
307
191
5,465
5.3%
17/40 ▶View entire presentation