UBS Results Presentation Deck
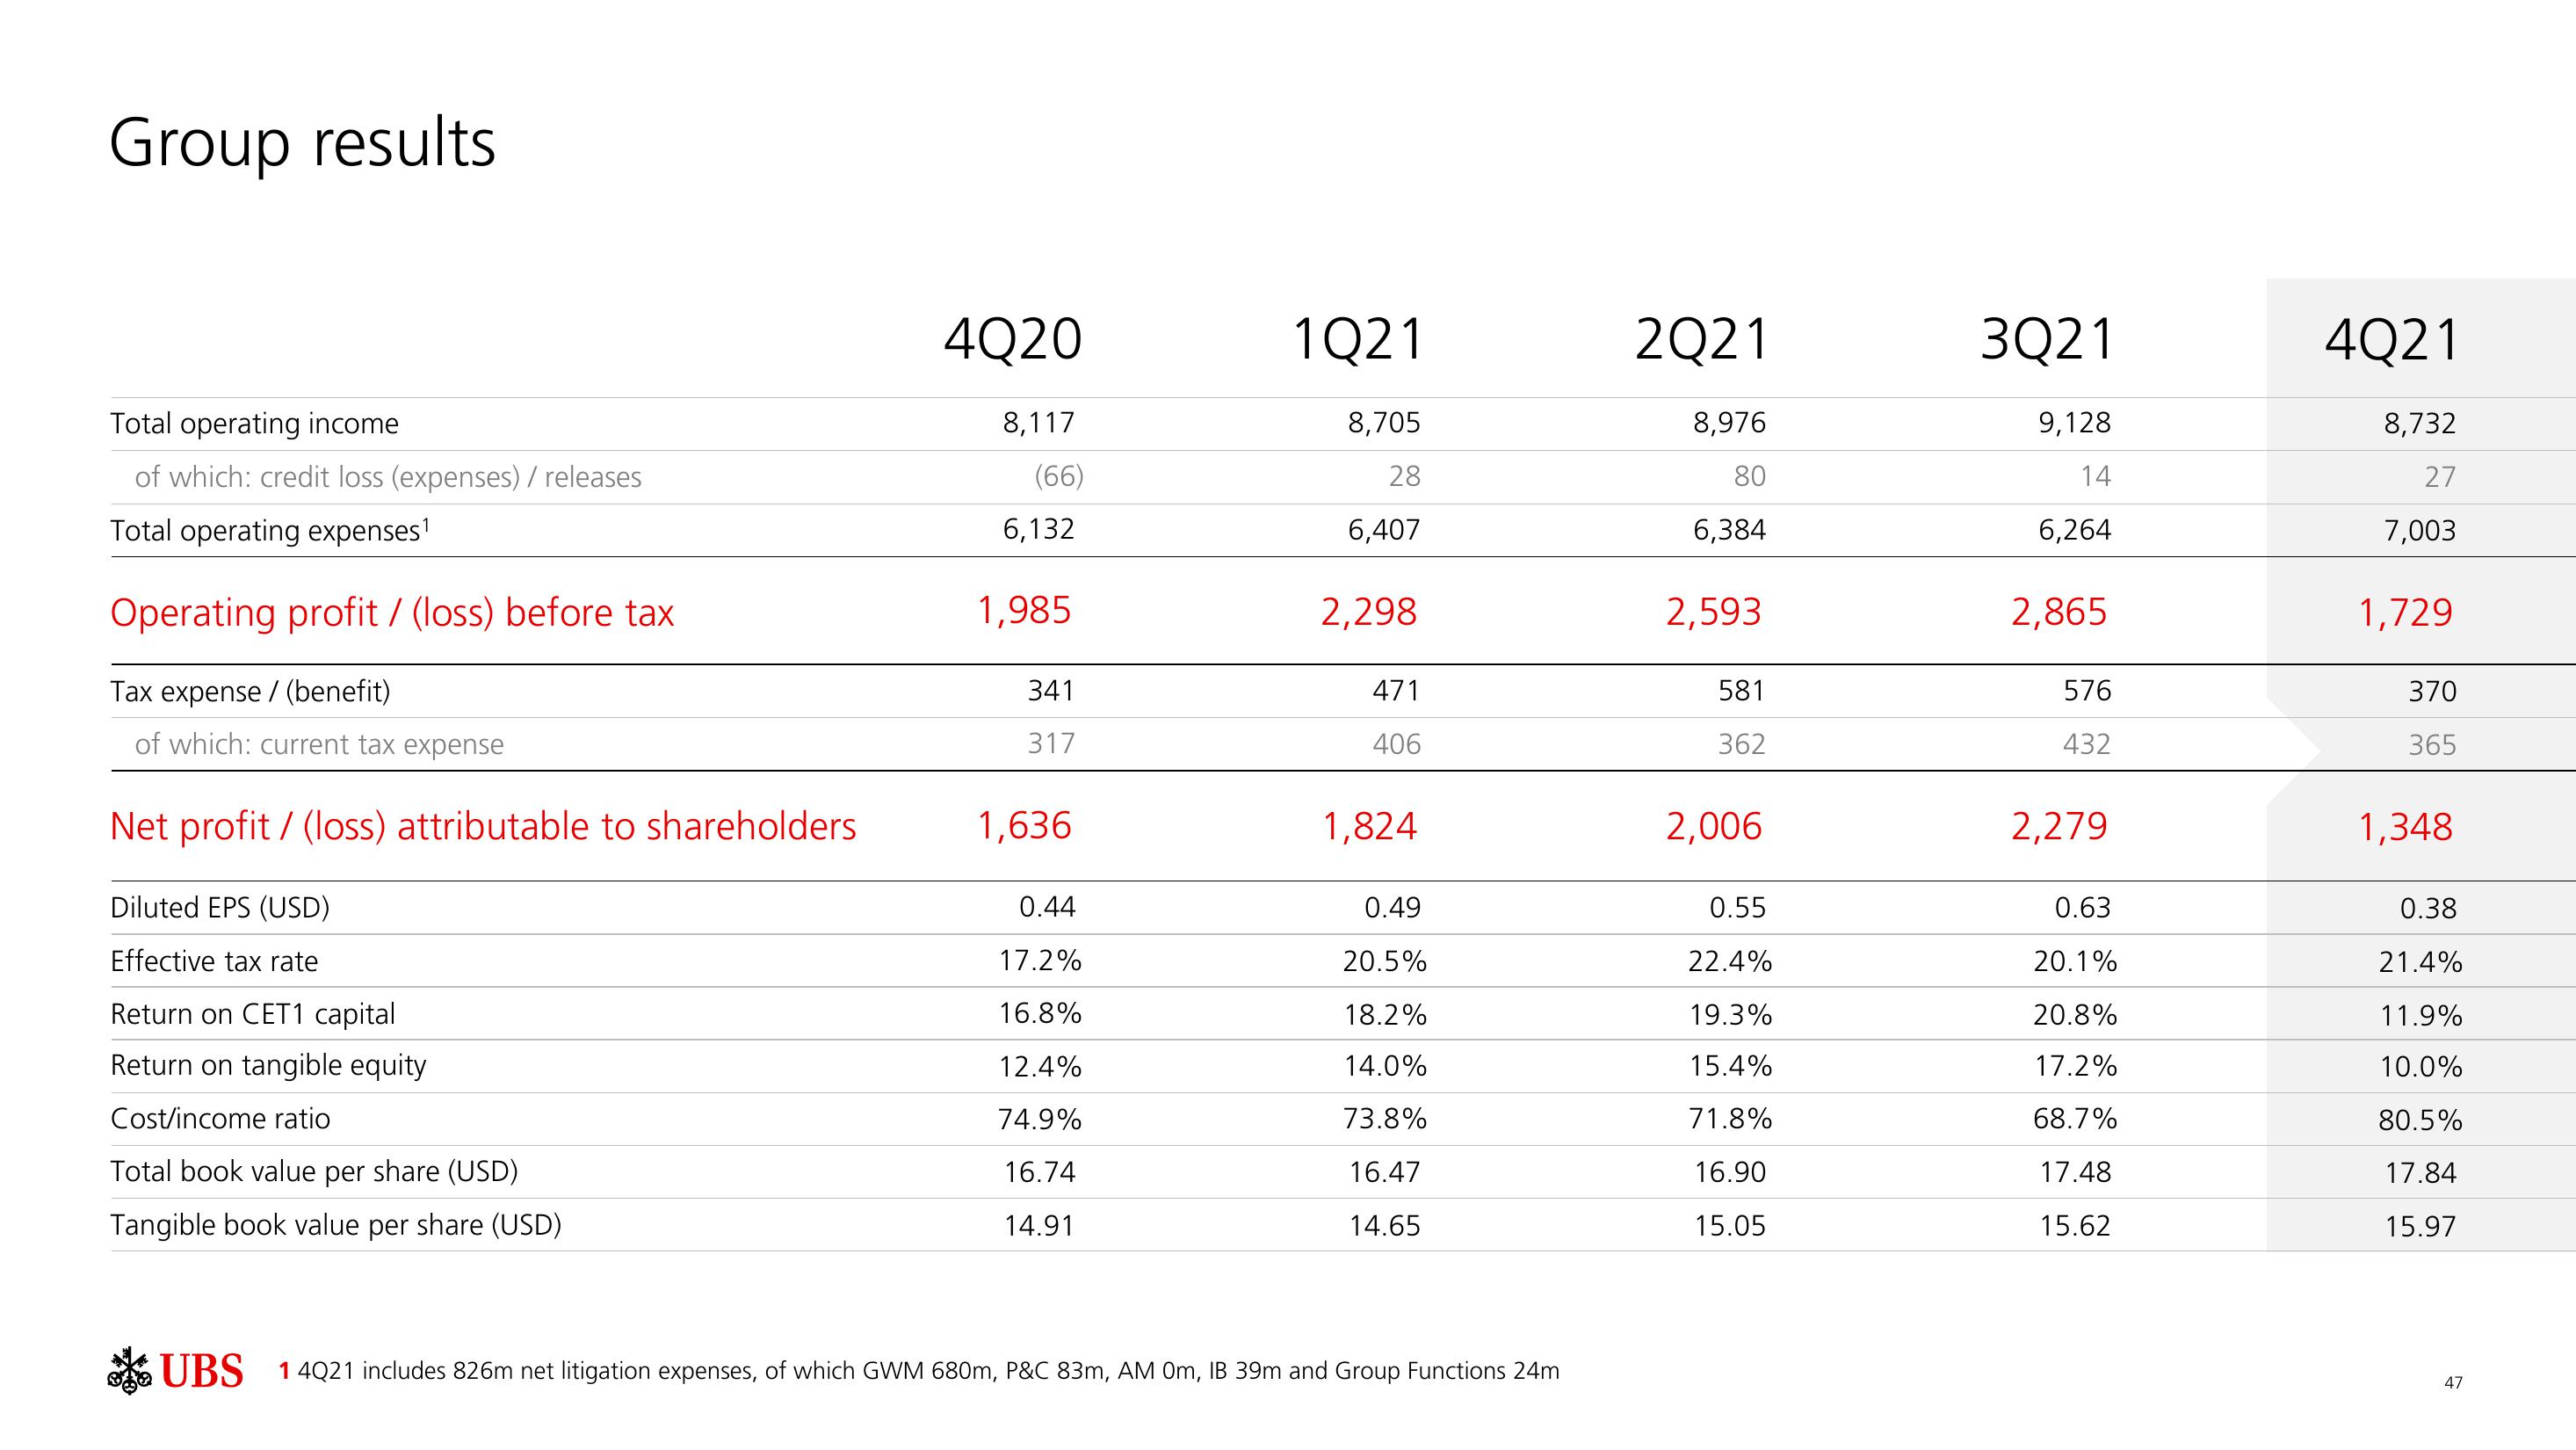
Group results
Total operating income
of which: credit loss (expenses) /releases
Total operating expenses¹
Operating profit/ (loss) before tax
Tax expense / (benefit)
of which: current tax expense
Net profit/ (loss) attributable to shareholders
Diluted EPS (USD)
Effective tax rate
Return on CET1 capital
Return on tangible equity
Cost/income ratio
Total book value per share (USD)
Tangible book value per share (USD)
4Q20
8,117
(66)
6,132
1,985
341
317
1,636
0.44
17.2%
16.8%
12.4%
74.9%
16.74
14.91
1Q21
8,705
28
6,407
2,298
471
406
1,824
0.49
20.5%
18.2%
14.0%
73.8%
16.47
14.65
UBS 14Q21 includes 826m net litigation expenses, of which GWM 680m, P&C 83m, AM 0m, IB 39m and Group Functions 24m
2Q21
8,976
80
6,384
2,593
581
362
2,006
0.55
22.4%
19.3%
15.4%
71.8%
16.90
15.05
3Q21
9,128
14
6,264
2,865
576
432
2,279
0.63
20.1%
20.8%
17.2%
68.7%
17.48
15.62
4Q21
8,732
27
7,003
1,729
370
365
1,348
0.38
21.4%
11.9%
10.0%
80.5%
17.84
15.97
47View entire presentation