EVE SPAC Presentation Deck
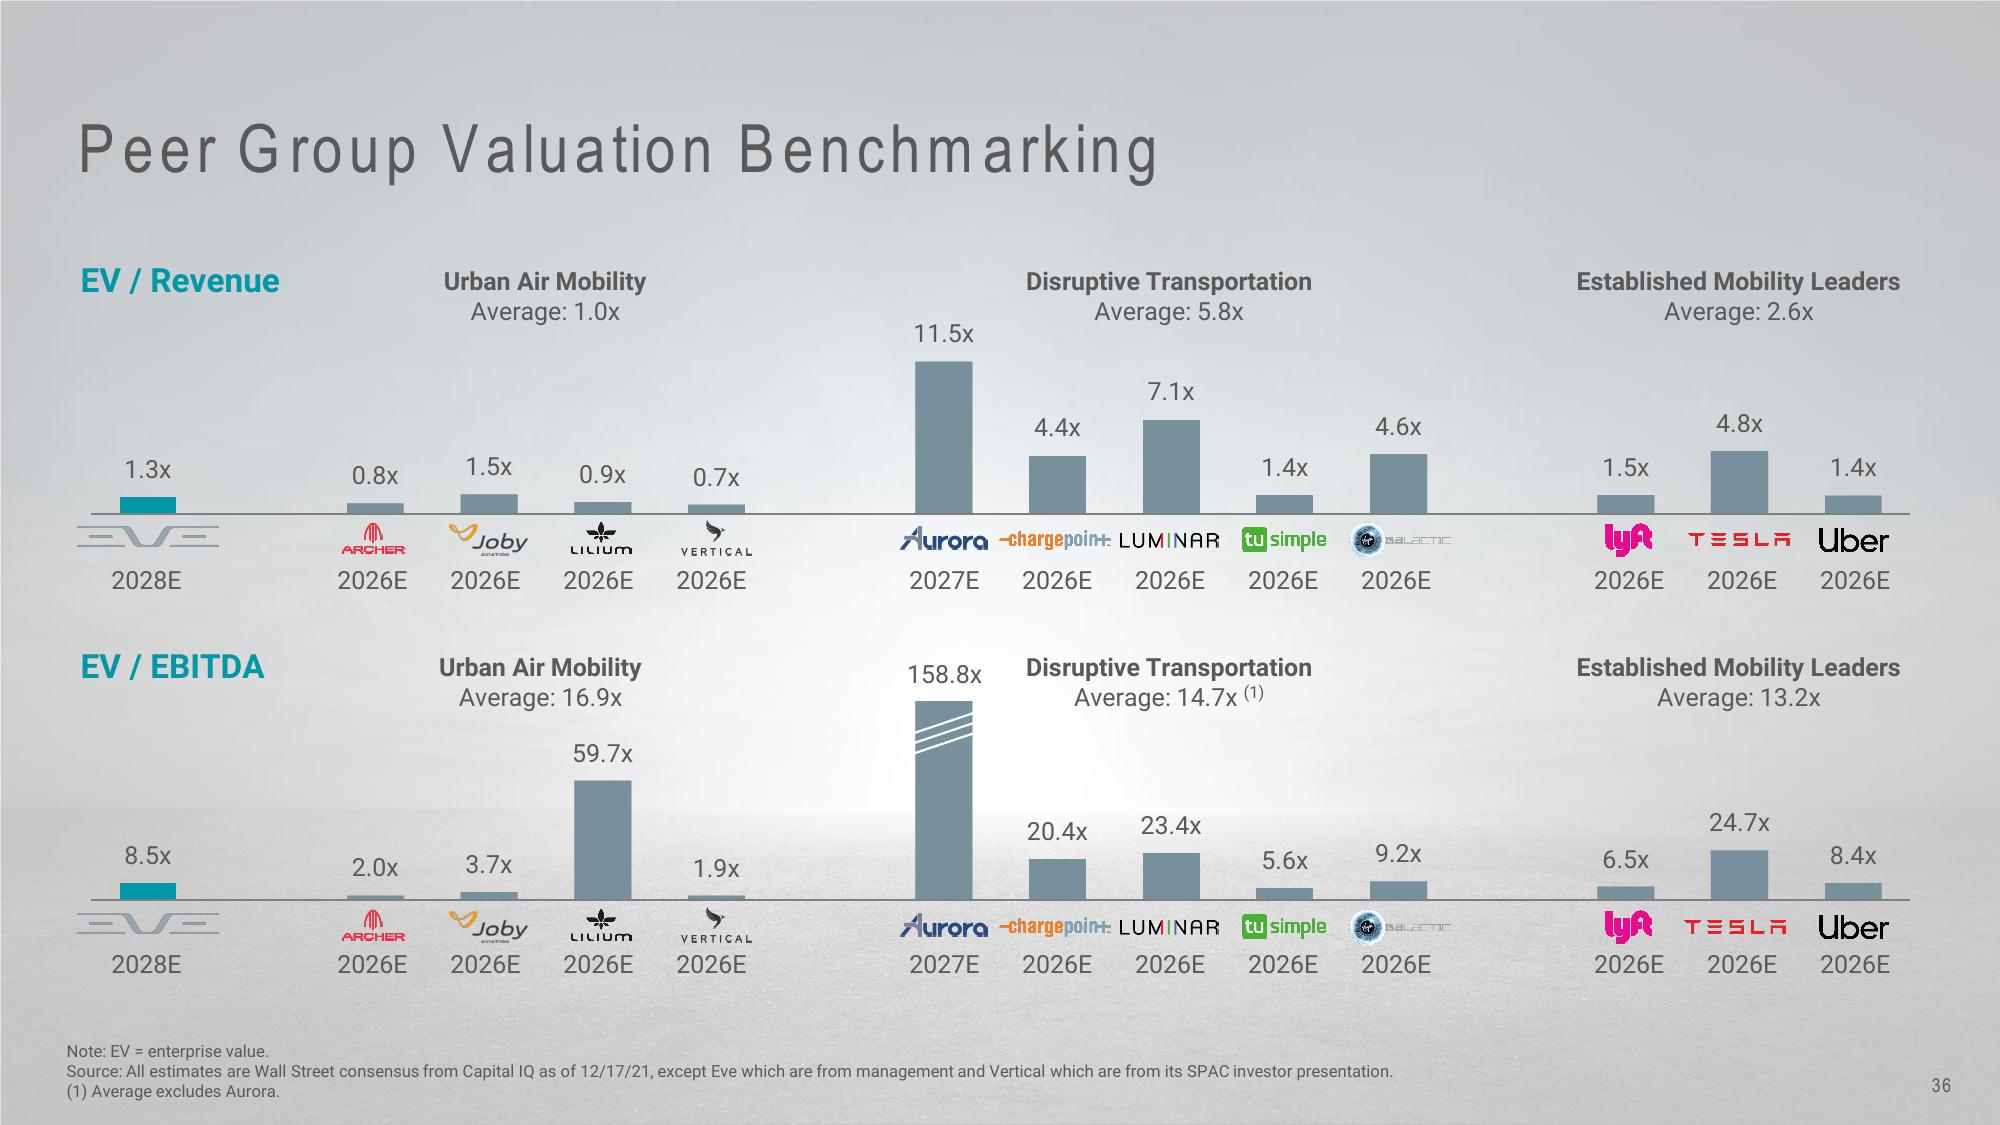
Peer Group Valuation Benchmarking
Urban Air Mobility
Average: 1.0x
EV / Revenue
1.3x
EVE
2028E
EV / EBITDA
8.5x
EVE
2028E
0.8x
ARCHER
2026E
2.0x
1.5x
0.9x
LILIUM
VERTICAL
Joby
2026E 2026E 2026E
Urban Air Mobility
Average: 16.9x
59.7x
3.7x
0.7x
1.9x
Joby
ARCHER
LILIUM
VERTICAL
2026E 2026E 2026E 2026E
11.5x
Disruptive Transportation
Average: 5.8x
158.8x
4.4x
Aurora -chargepoin+: LUMINAR
2027E 2026E 2026E
7.1x
20.4x
1.4x
Disruptive Transportation
Average: 14.7x (1)
23.4x
tu simple
2026E
5.6x
4.6x
GALACTIC
2026E
9.2x
Aurora -chargepoint: LUMINAR tu simple
2027E 2026E 2026E 2026E 2026E
BALACTIC
Note: EV = enterprise value.
Source: All estimates are Wall Street consensus from Capital IQ as of 12/17/21, except Eve which are from management and Vertical which are from its SPAC investor presentation.
(1) Average excludes Aurora.
Established Mobility Leaders
Average: 2.6x
1.5x
4.8x
LyA TESLA Uber
2026E 2026E 2026E
6.5x
1.4x
Established Mobility Leaders
Average: 13.2x
24.7x
8.4x
lyA TESLA Uber
2026E 2026E 2026E
36View entire presentation