Q4 2020 Investor Presentation
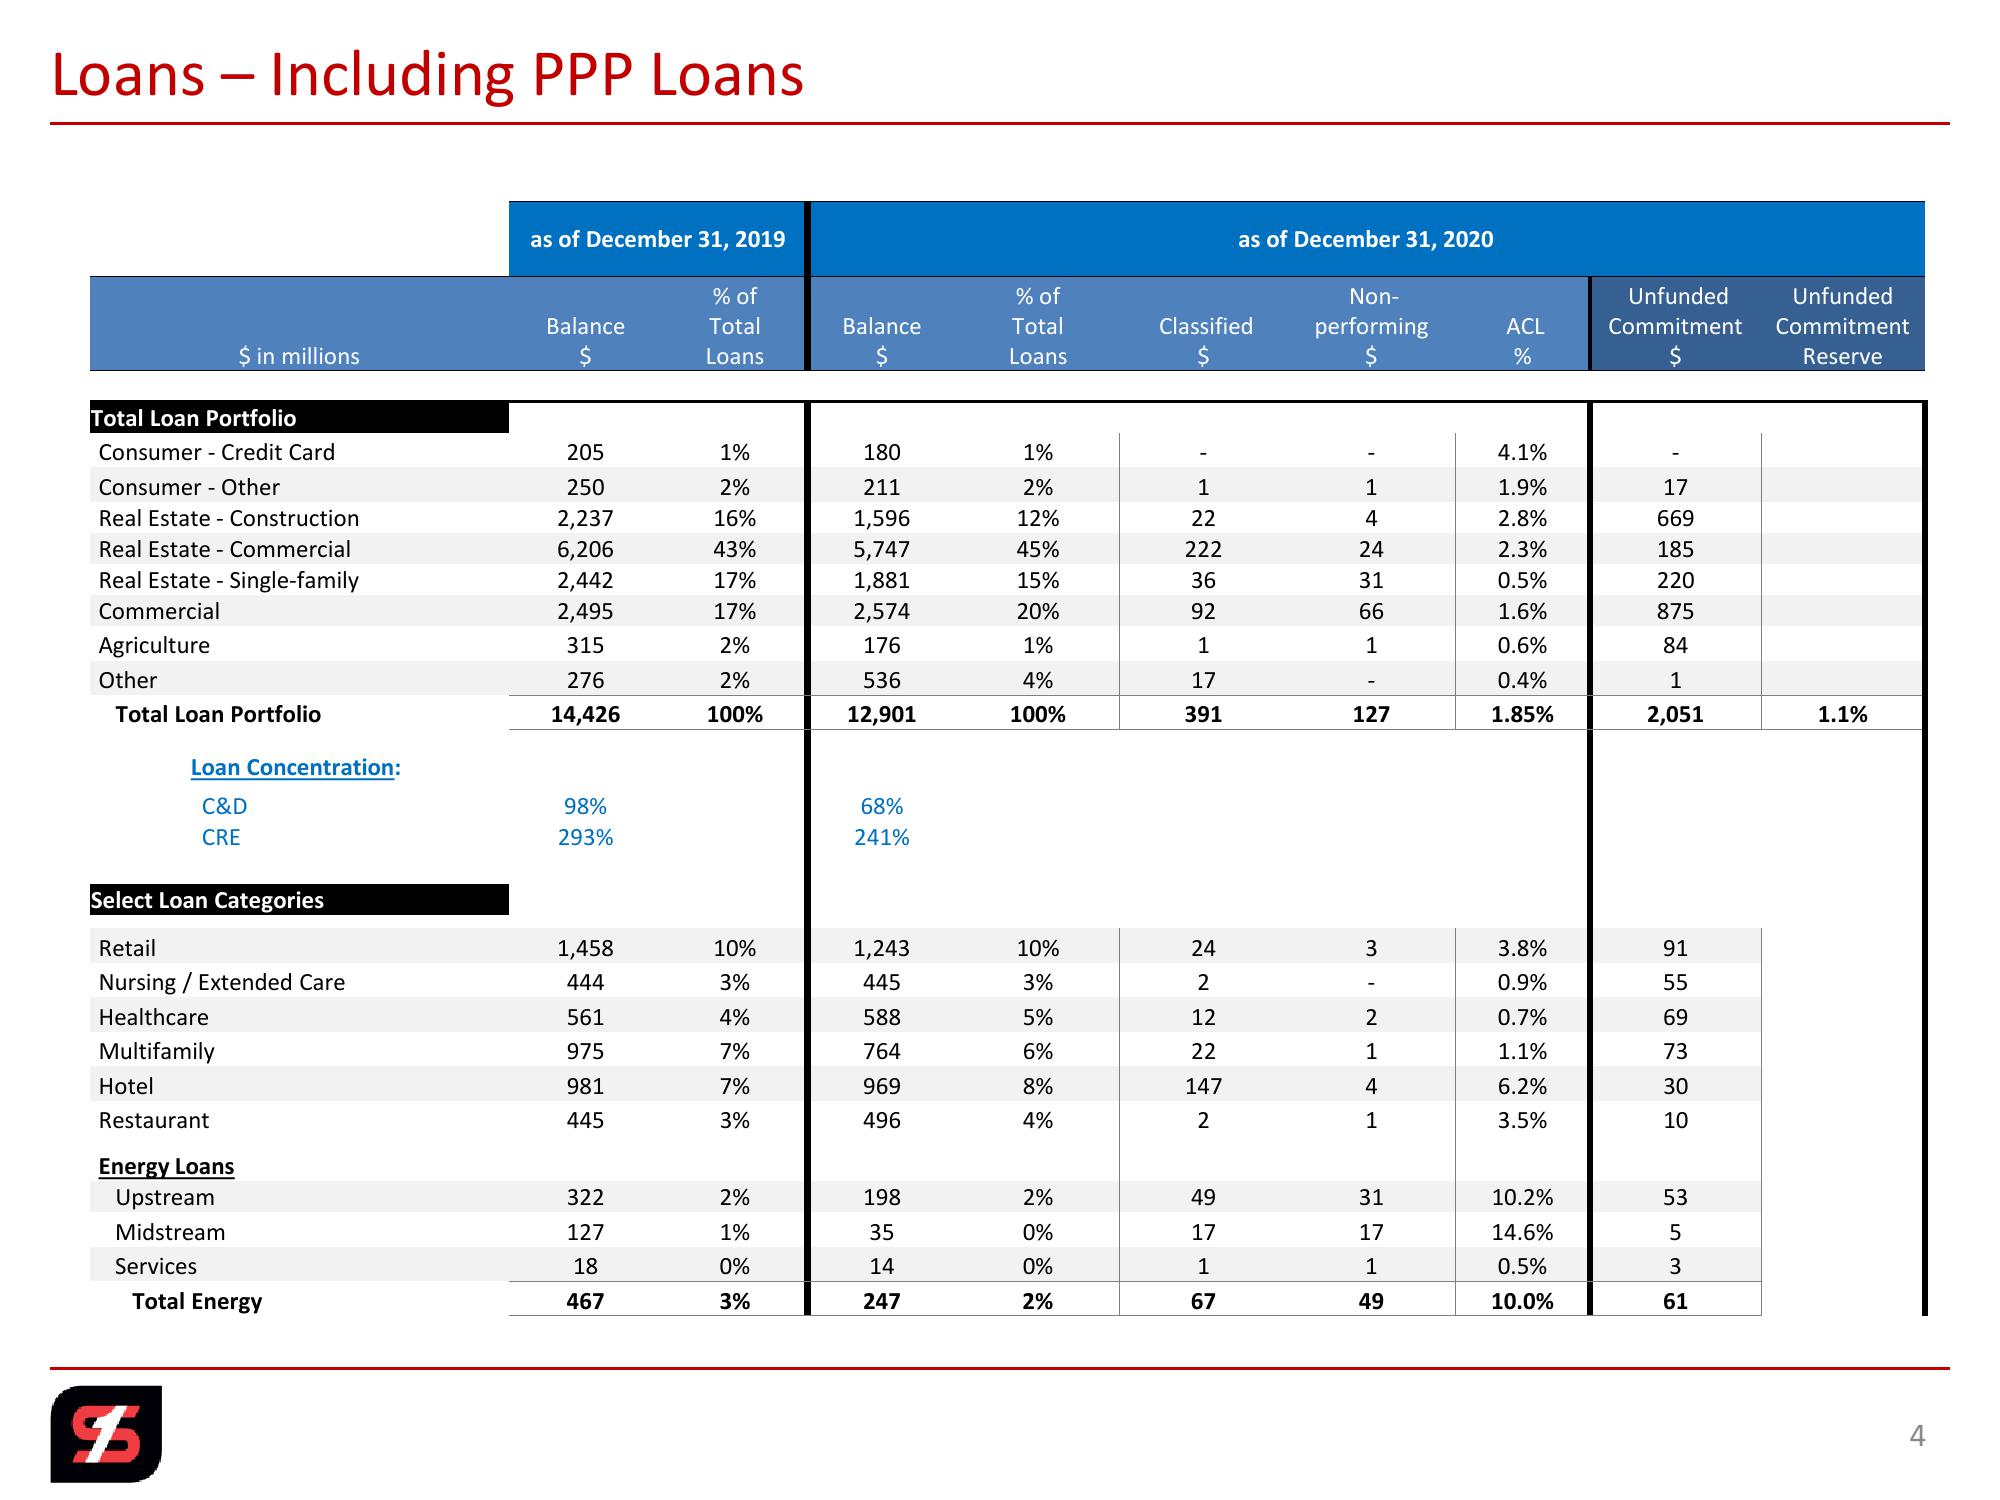
Loans - Including PPP Loans
as of December 31, 2019
as of December 31, 2020
% of
% of
Balance
Total
Balance
Total
Classified
Non-
performing
$ in millions
Loans
Loans
$
ACL
%
Unfunded Unfunded
Commitment Commitment
Reserve
Total Loan Portfolio
Consumer Credit Card
205
1%
180
1%
4.1%
Consumer Other
250
2%
211
2%
1
1
1.9%
17
Real Estate Construction
2,237
16%
1,596
12%
22
4
2.8%
669
Real Estate Commercial
6,206
43%
5,747
45%
222
24
2.3%
185
Real Estate - Single-family
2,442
17%
1,881
15%
36
31
0.5%
220
Commercial
2,495
17%
2,574
20%
92
66
1.6%
875
Agriculture
315
2%
176
1%
1
1
0.6%
84
Other
276
2%
536
4%
17
0.4%
1
Total Loan Portfolio
14,426
100%
12,901
100%
391
127
1.85%
2,051
1.1%
Loan Concentration:
C&D
CRE
98%
293%
68%
241%
Select Loan Categories
Retail
1,458
10%
1,243
10%
24
Nursing/Extended Care
444
3%
445
3%
2
Healthcare
561
4%
588
5%
12
Multifamily
975
7%
764
6%
22
Hotel
981
7%
969
8%
147
Restaurant
445
3%
496
4%
2
31214-
3.8%
91
0.9%
55
0.7%
69
1.1%
73
6.2%
30
3.5%
10
Energy Loans
Upstream
322
2%
198
2%
49
31
10.2%
Midstream
127
1%
35
0%
17
17
14.6%
Services
18
0%
14
0%
1
1
0.5%
Total Energy
467
3%
247
2%
67
49
10.0%
3535
61
$
4View entire presentation