Privia Health IPO Presentation Deck
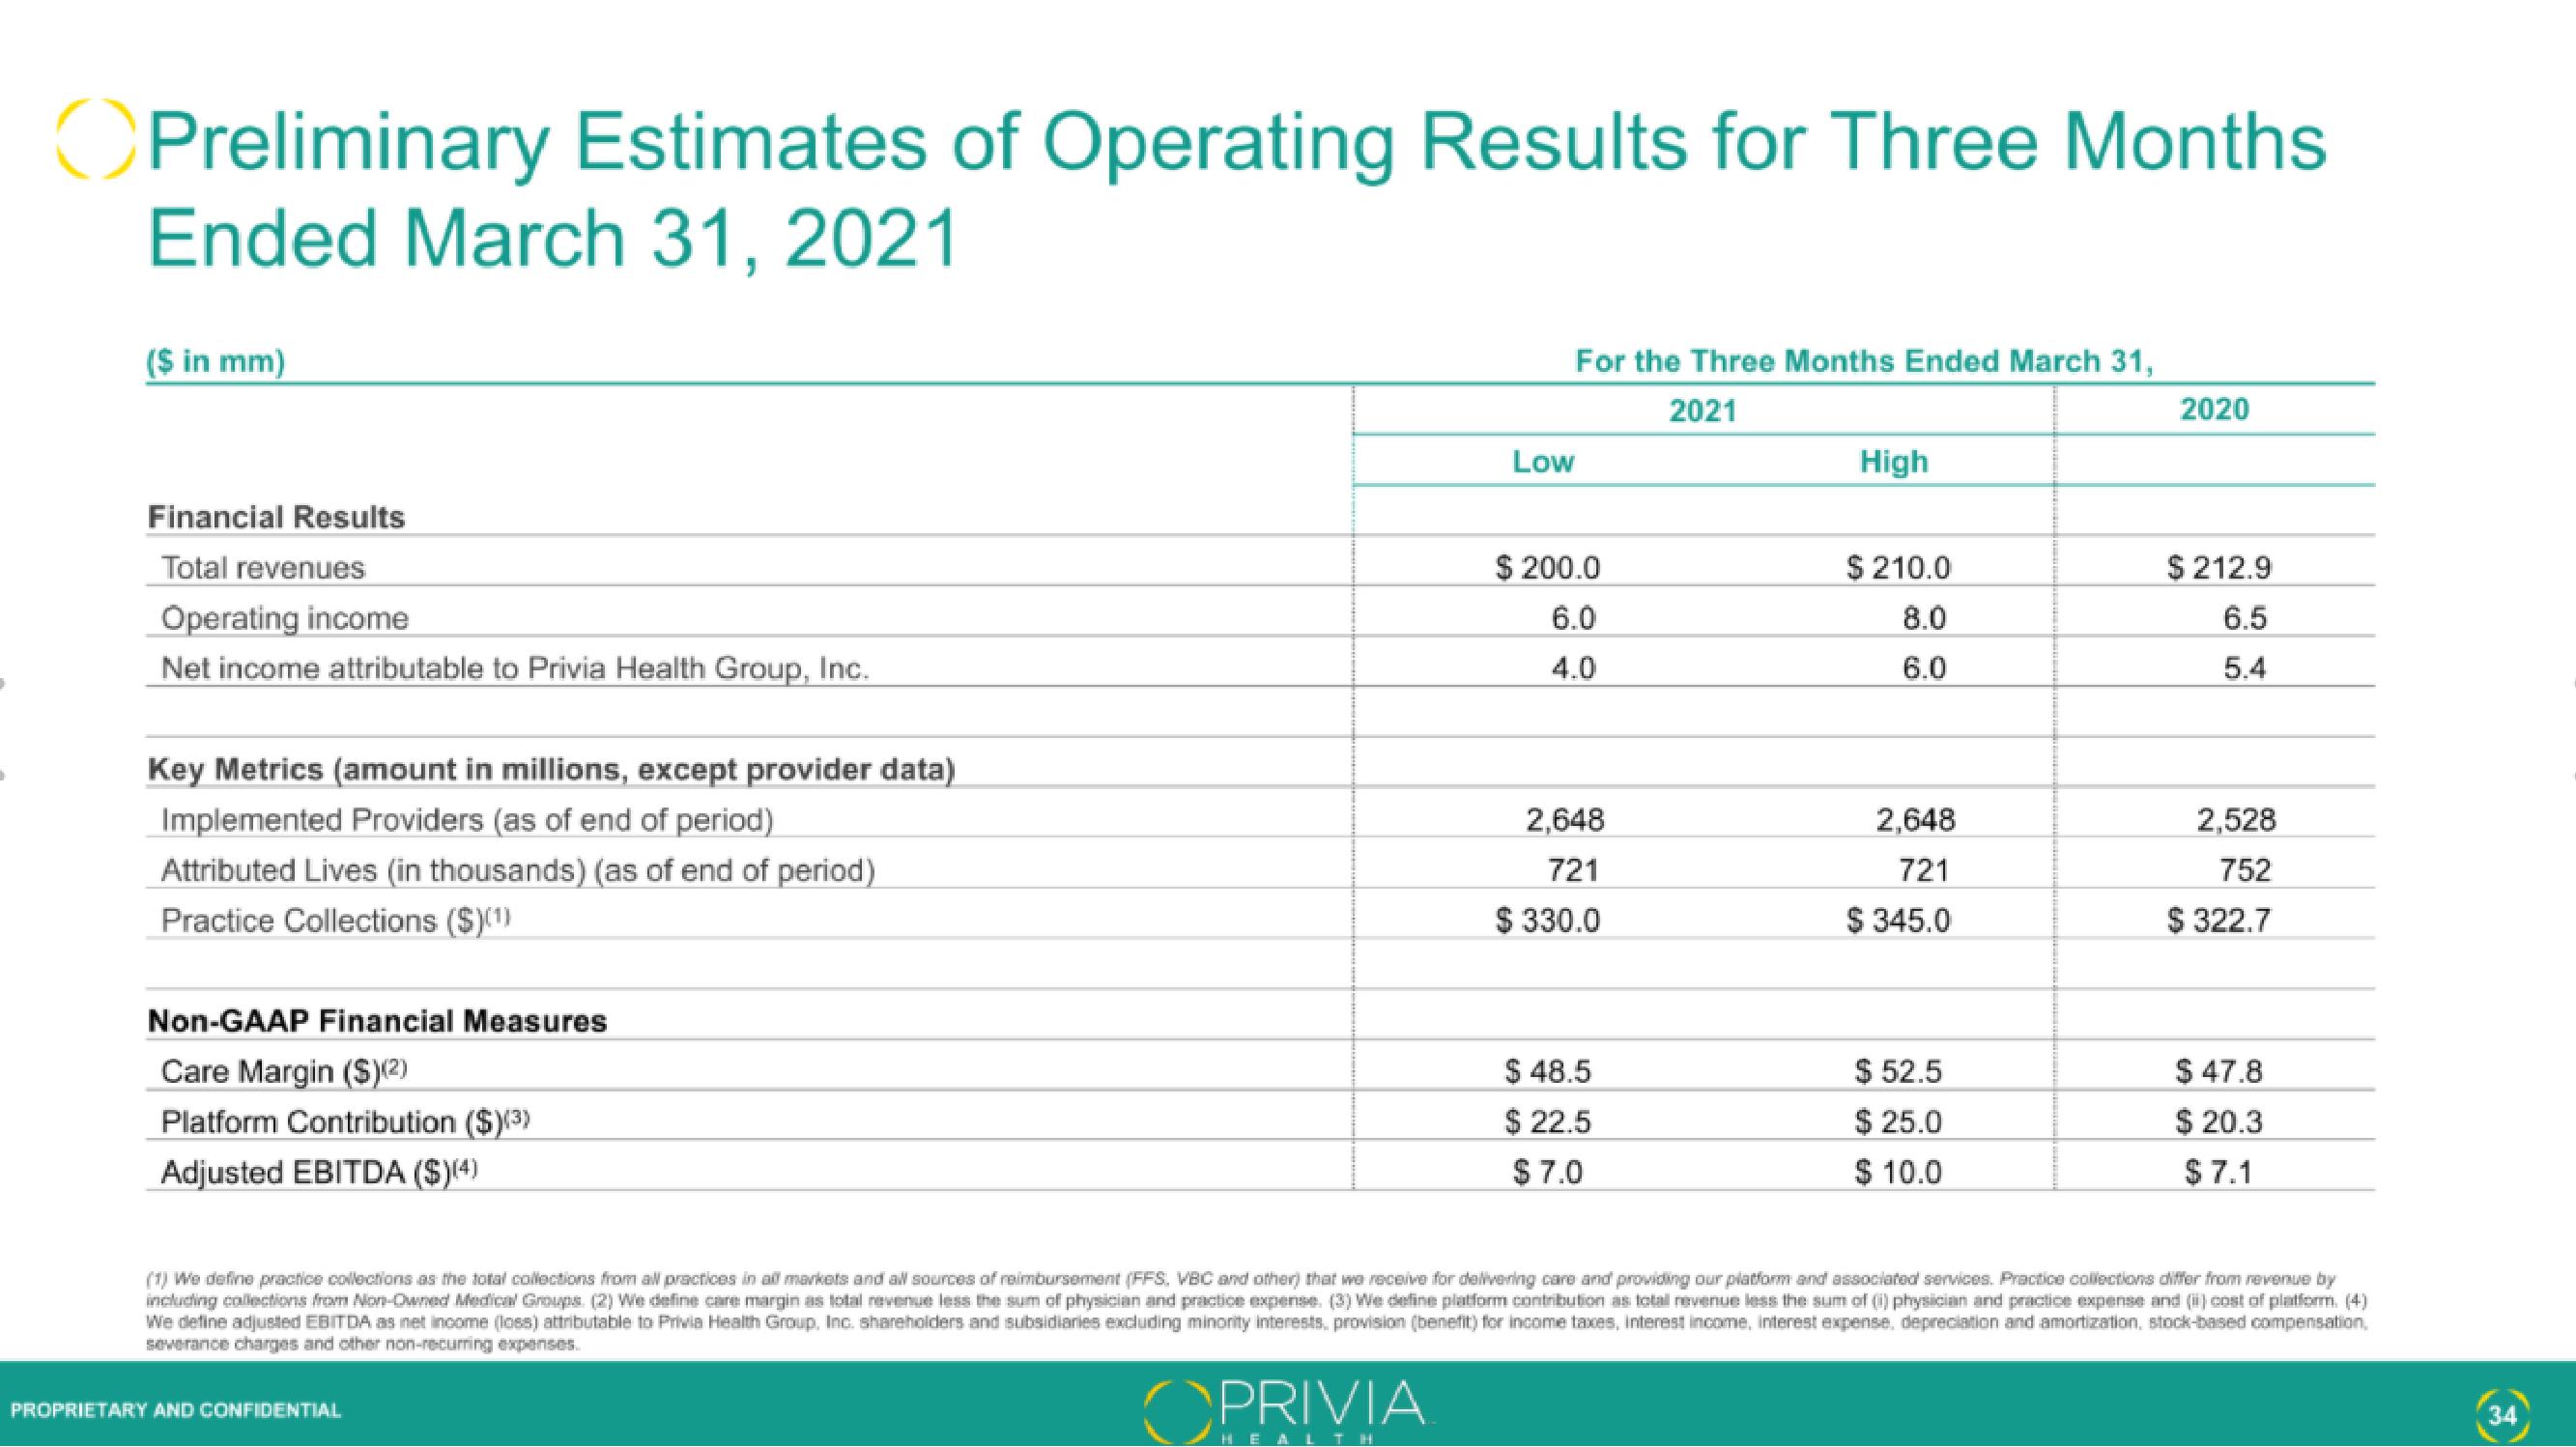
Preliminary Estimates of Operating Results for Three Months
Ended March 31, 2021
($ in mm)
Financial Results
Total revenues
Operating income
Net income attributable to Privia Health Group, Inc.
Key Metrics (amount in millions, except provider data)
Implemented Providers (as of end of period)
Attributed Lives (in thousands) (as of end of period)
Practice Collections ($)(¹)
Non-GAAP Financial Measures
Care Margin ($)(2)
Platform Contribution ($)(³)
Adjusted EBITDA ($)(4)
Low
PROPRIETARY AND CONFIDENTIAL
For the Three Months Ended March 31,
2021
$ 200.0
6.0
4.0
2,648
721
$330.0
$ 48.5
22.5
$
$ 7.0
High
$ 210.0
8.0
6.0
2,648
721
$345.0
$ 52.5
$ 25.0
$ 10.0
2020
$ 212.9
6.5
5.4
2,528
752
$ 322.7
$ 47.8
$ 20.3
$7.1
(1) We define practice collections as the total collections from all practices in al markets and all sources of reimbursement (FFS, VBC and other) that we receive for delivering care and providing our platform and associated services. Practice collections differ from revenue by
including collections from Non-Owned Medical Groups. (2) We define care margin as total revenue less the sum of physician and practice expense. (3) We define platform contribution as total revenue less the sum of (i) physician and practice expense and (ii) cost of platform. (4)
We define adjusted EBITDA as net income (loss) attributable to Privia Health Group, Inc. shareholders and subsidiaries excluding minority interests, provision (benefit) for income taxes, interest income, interest expense, depreciation and amortization, stock-based compensation,
severance charges and other non-recurring expenses.
OPRIVIA
34View entire presentation