Lumen Investor Day Presentation Deck
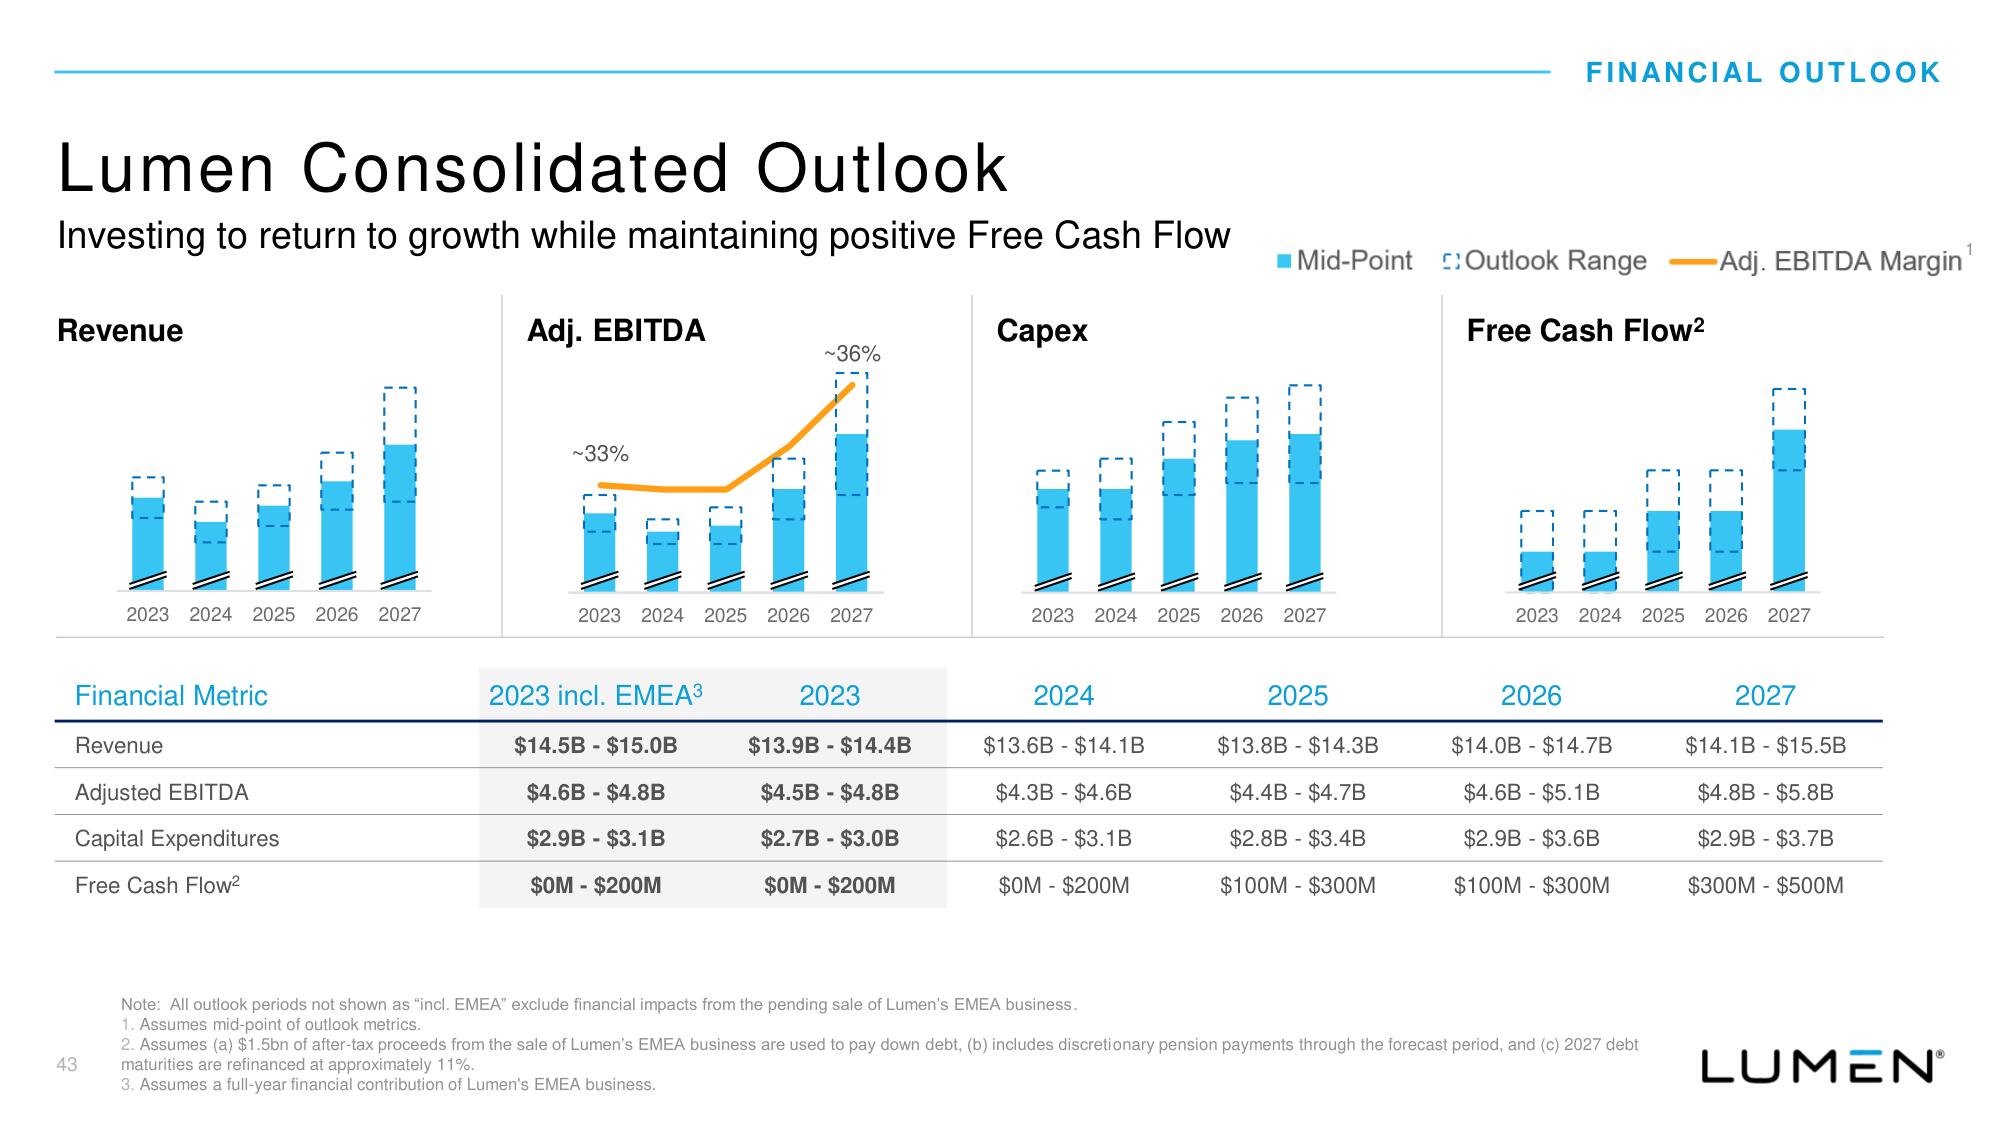
Lumen Consolidated Outlook
Investing to return to growth while maintaining positive Free Cash Flow
Revenue
2023 2024 2025 2026 2027
Financial Metric
Revenue
Adjusted EBITDA
Capital Expenditures
Free Cash Flow²
43
Adj. EBITDA
~33%
~36%
2023 2024 2025 2026 2027
2023 incl. EMEA³
$14.5B $15.0B
$4.6B - $4.8B
$2.9B- $3.1B
$OM - $200M
2023
$13.9B - $14.4B
$4.5B - $4.8B
$2.7B - $3.0B
$OM - $200M
Capex
2023 2024 2025 2026 2027
2024
■Mid-Point
$13.6B $14.1B
$4.3B - $4.6B
$2.6B - $3.1B
$0M - $200M
2025
$13.8B $14.3B
$4.4B - $4.7B
$2.8B - $3.4B
$100M $300M
FINANCIAL OUTLOOK
Outlook Range
Free Cash Flow²
2026
$14.0B $14.7B
$4.6B - $5.1B
$2.9B - $3.6B
$100M $300M
I
2023 2024 2025 2026 2027
Note: All outlook periods not shown as "incl. EMEA" exclude financial impacts from the pending sale of Lumen's EMEA business.
1. Assumes mid-point of outlook metrics.
2. Assumes (a) $1.5bn of after-tax proceeds from the sale of Lumen's EMEA business are used to pay down debt, (b) includes discretionary pension payments through the forecast period, and (c) 2027 debt
maturities are refinanced at approximately 11%.
3. Assumes a full-year financial contribution of Lumen's EMEA business.
1
I
-Adj. EBITDA Margin
2027
$14.1B $15.5B
$4.8B - $5.8B
$2.9B - $3.7B
$300M $500M
LUMENⓇ
1View entire presentation