Kinnevik Results Presentation Deck
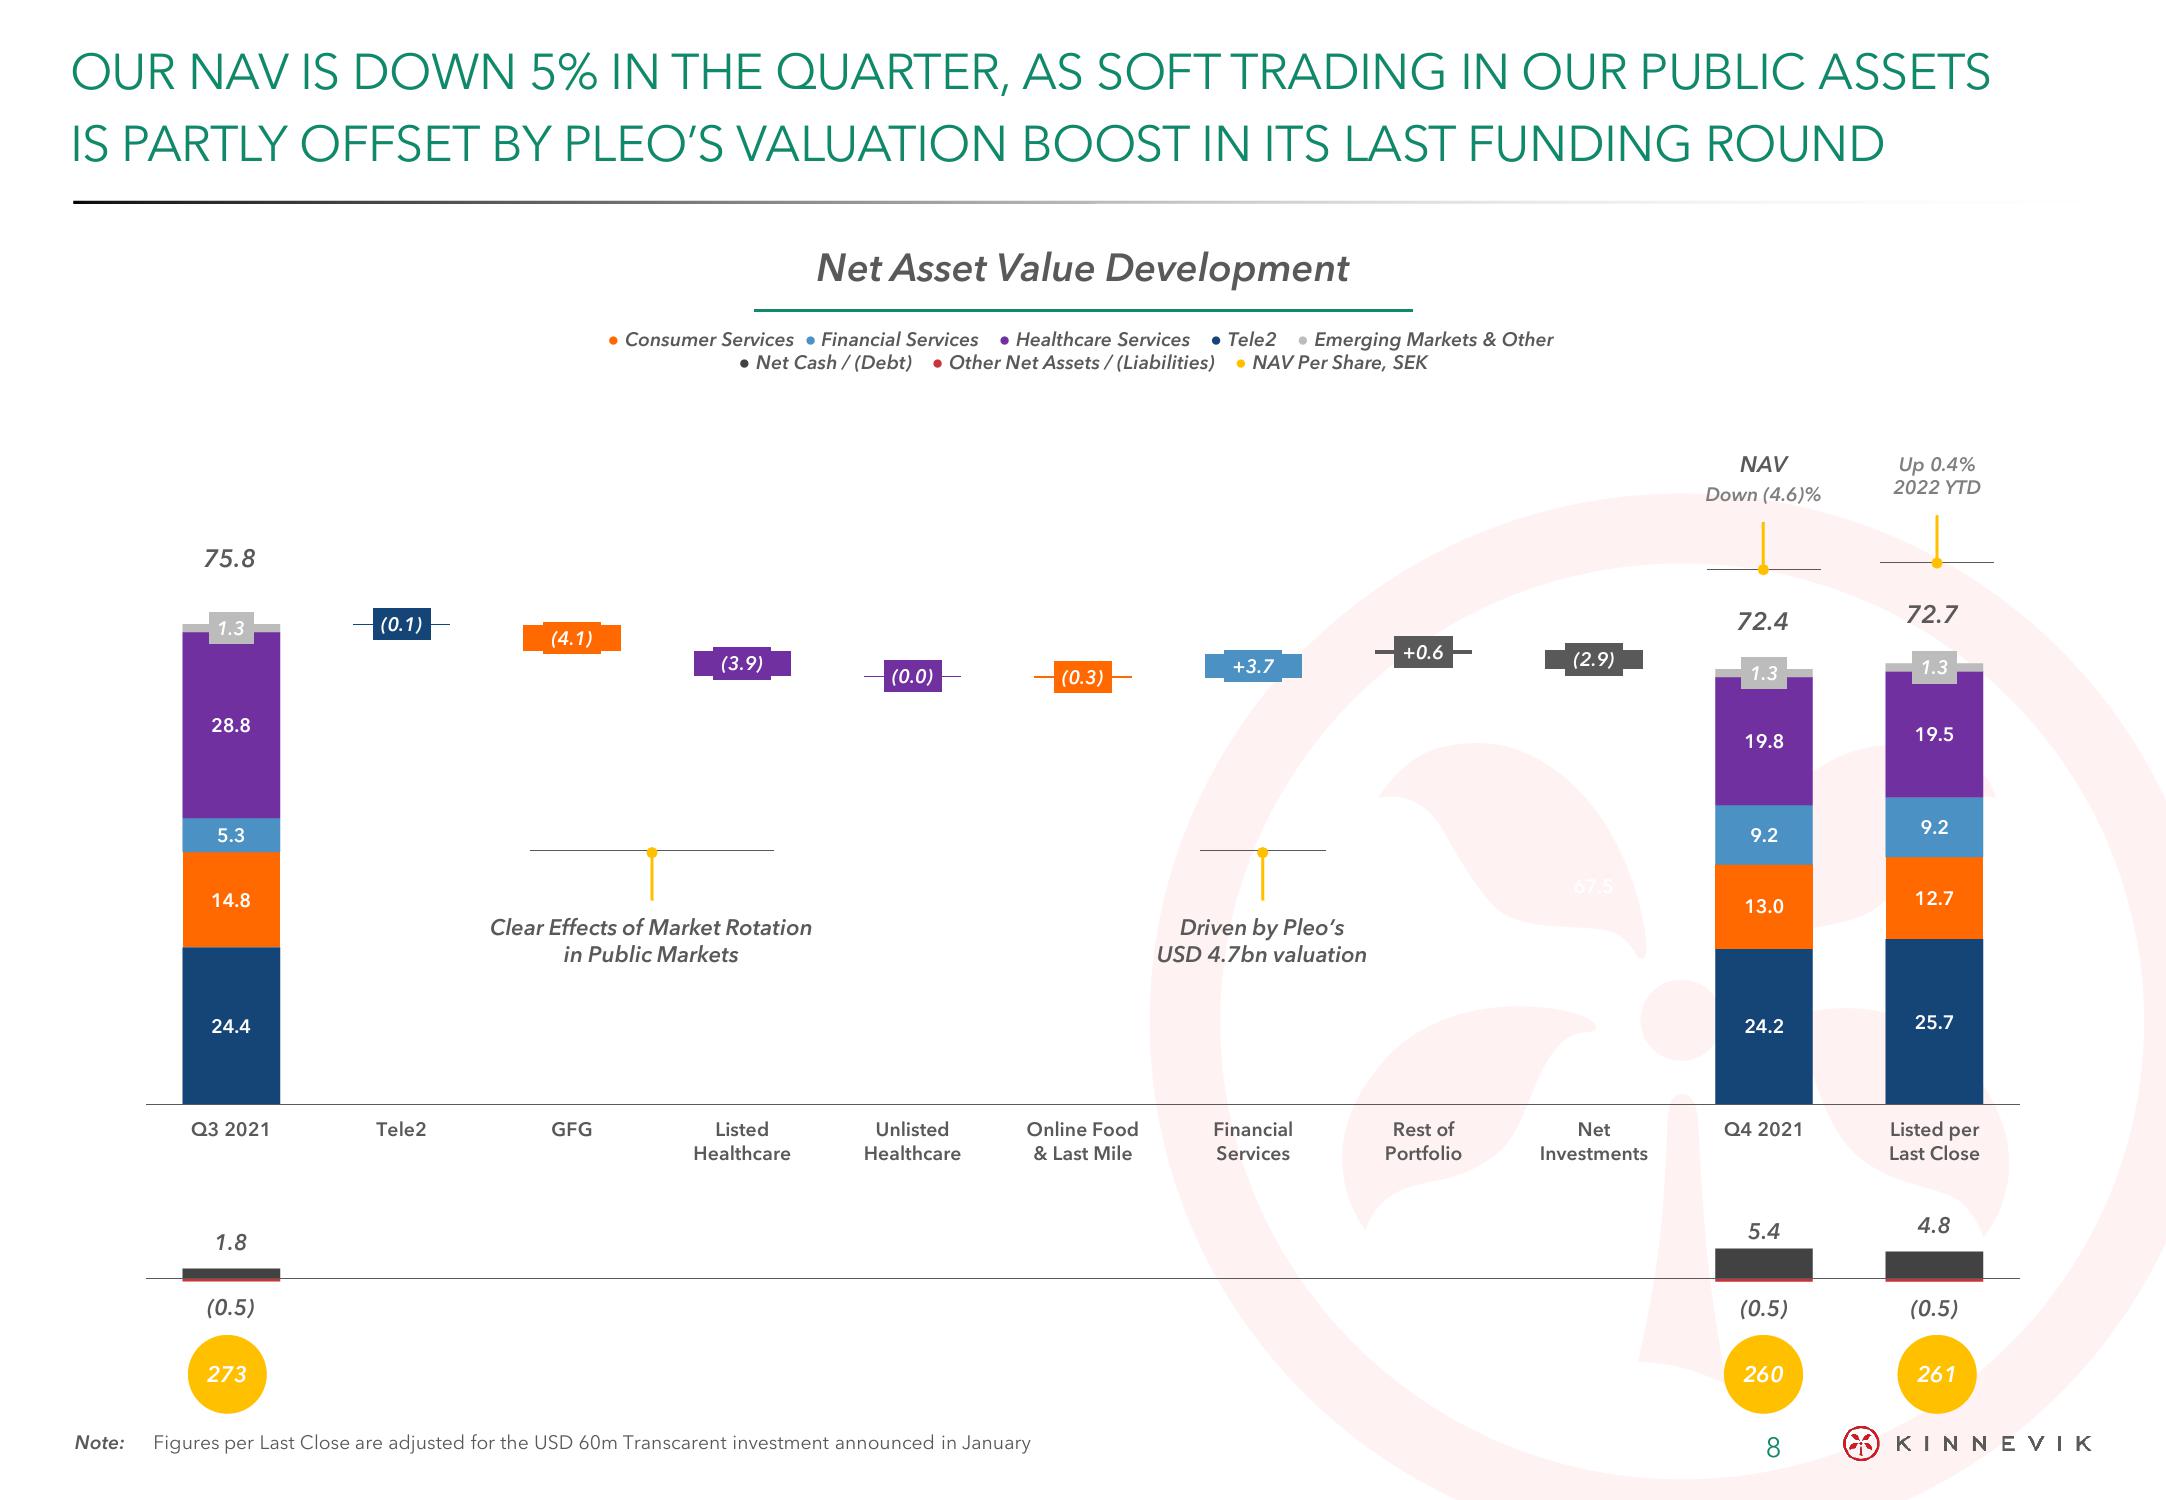
OUR NAV IS DOWN 5% IN THE QUARTER, AS SOFT TRADING IN OUR PUBLIC ASSETS
IS PARTLY OFFSET BY PLEO'S VALUATION BOOST IN ITS LAST FUNDING ROUND
Note:
75.8
1.3
28.8
5.3
14.8
24.4
Q3 2021
1.8
(0.5)
273
(0.1)
Tele2
(4.1)
Net Asset Value Development
• Consumer Services Financial Services Healthcare Services Tele2 Emerging Markets & Other
.Net Cash/(Debt) • Other Net Assets/(Liabilities) NAV Per Share, SEK
GFG
(3.9)
Clear Effects of Market Rotation
in Public Markets
Listed
Healthcare
(0.0)
Unlisted
Healthcare
(0.3)
Online Food
& Last Mile
Figures per Last Close are adjusted for the USD 60m Transcarent investment announced in January
+3.7
Driven by Pleo's
USD 4.7bn valuation
Financial
Services
+0.6
Rest of
Portfolio
(2.9)
Net
Investments
NAV
Down (4.6)%
72.4
1.3
19.8
9.2
13.0
24.2
Q4 2021
5.4
(0.5)
260
8
Up 0.4%
2022 YTD
72.7
1.3
19.5
9.2
12.7
25.7
Listed per
Last Close
4.8
(0.5)
261
(5) ΚΙΝΝΕVIKView entire presentation